-
Notifications
You must be signed in to change notification settings - Fork 16
MRI_g_ratio_Tools
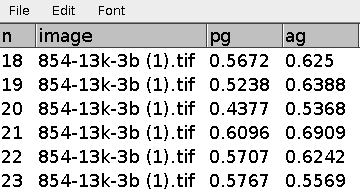
In images from transmission electron microscopy of the optic nerve, calculate the g-ratio of the axons. The pg-factor and the ag-factor will be measured. The pg-factor is the inner perimeter of the neuron divided by the outer perimeter including the myelin. The ag-factor is the square-root of the area of the inner surface divided by the area of the outer surface including the myelin. You can find example input images here and here.
You need to have MorphoLibJ installed, see here. To install the tools, drag the link MRI_g-ratio_tools to the ImageJ launcher window, save it under macros/toolsets in the ImageJ installation and restart ImageJ. To accelerate the calculation install the plugin Grow_Regions by saving the file grow_regions.jar into the plugins folder of FIJI. The source code of the plugin is available here: Grow_Regions.java.
- the first button (the one with the image) opens this help page
- The p button runs a preprocessing step that creates a hyperstack of the original image and a thresholded version of it.
- the d button will run the detection of the axons (the inner parts)
- the r button renames the rois starting from the first selected roi in the roi-manager. Use this after manual additions/deletions so that the numbers in the results table will correspond to the numbers in the roi-names.
- the f button will run the detection of the outer borders including the myelin
- the s button allows to smooth the current selection
- the m button will measure the pg-factor and the ag-factor
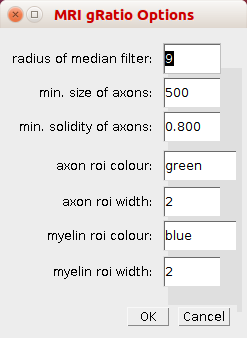
Open the options-dialog by right-clicking on the button with the image.
- radius of median filter - Before the image is thresholded to create a mask a median filter with the given radius is applied
- min. size of axons - When detecting the axons, objects smaller than the min. size will not be taken into account
- min. solidity of axons - When detecting the axons, objects with a smaller solidity will be considered background
- axon roi colour - The colour of the rois for the axons.
- axon roi width - The width of the rois for the axons.
- myelin roi colour - The colour of the rois for the myelin
- myelin roi width - The width of the rois for the myelin.
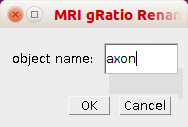
By right-clicking on the r-button you can open the options dialog for the rename rois tool.
- object name - The name of the objects selected, i.e. the base name of the rois.
Open an input image and press the p-button to prepare the image. This will create an overlay of the original image and a binary mask of the image which will be needed for the next steps.
Press the d-button to detect the axons. If necessary correct the resulting selections manually. Remove background areas that have been selected, correct the contour of selections by clicking on the label of the selection, than using the brush selection tool and pressing update on the roi-manager. Make sure that all axons are selected including those that touch the borders of the image.
Press the r-button to rename the rois so that the numbers in the results table will correspond to the numbers in the roi-manager.
Press the f-button to detect the myelin around the axons. This step will take some time. While working the number of time steps (generations) is displayed in the log-window. After the detection finished you can again manually correct the selections. You can use the s-button to smooth an existing selection.
Press the m-button to measure the pg and the ag-factor.
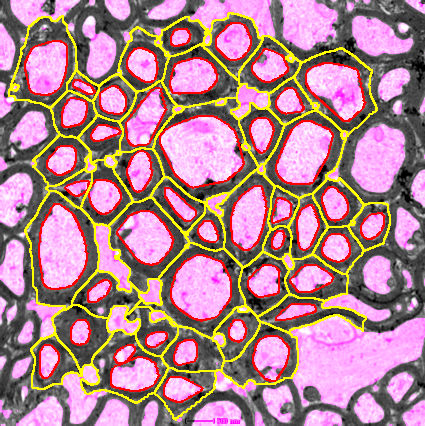
Results before manual corrections:


A median filter is applied to the image. An automatic threshold (Default dark) is applied to the image and the image is converted to a mask. The fill hole command is called. The particle analyzer is used to detect the axons and axons too small or with a solidity not high enough are removed. For the remaining selections the convex hull is calculated and then interpolated with interval 1 and the smooth option activated. The selections are renamed to axon followed by a number consisting of 4 digits.
When pressing the f-button. First the area covered by axons, by myelin and by empty space are calculated and the axons are counted.
An index mask is created from the axon image and combined with the binary mask. The result is an image where pixels belonging to an axon have the number of the axon, pixels belonging to the surrounding myelin have the value 0 and background pixels (neither axon nor surrounding myelin) have the value 255. A cellular automaton is used to determine for each myelin pixel to which axon it belongs. In each step for a pixel with value 0 the value in the next generation will be the maximum value of its neighbours (4-connected neighbourhood) where background pixels (255) are given the value 0. The iteration ends when in one step no more modifications are made.
-
Baudouin, L., Adès, N., Kanté, K., Bachelin, C., Hmidan, H., Deboux, C., Panic, R., Ben Messaoud, R., Velut, Y., Hamada, S., Pionneau, C., Duarte, K., Poëa‐Guyon, S., Barnier, J., Nait Oumesmar, B., Bouslama‐Oueghlani, L., 2024. Antagonistic actions of PAK1 and NF2 /Merlin drive myelin membrane expansion in oligodendrocytes. Glia 72, 1518–1540.
-
Baudouin, L., Adès, N., Kanté, K., Czarnecki, A., Bachelin, C., Baskaran, A., Langui, D., Millécamps, A., Gurchenkov, B., Velut, Y., Duarte, K., Barnier, J., Nait Oumesmar, B., Bouslama‐Oueghlani, L., 2021. Co‐culture of exogenous oligodendrocytes with unmyelinated cerebella: Revisiting ex vivo models and new tools to study myelination. Glia 69, 1916–1931. https://doi.org/10.1002/glia.24001
-
Wolfe, T., Hoffman, K., Hogan, M.K., Salazar, B., Tang, X., Chaboub, L., Quini, C.C., Lu, Z., and Horner, P.J. (2021). Quantification of Myelinated Nerve Fraction and Degeneration in Spinal Cord Neuropil by SHIFT MRI. J Magn Reson Imaging 53, 1162–1174.
-
Atkinson, R. (2018). Frontotemporal dementia and amyotrophic lateral sclerosis proteins in neurite health and dysfunction. University of Tasmania.
-
MyelTracer
- An opencv based semi-automatic solution for windows and mac.


 Volker Bäcker