-
Notifications
You must be signed in to change notification settings - Fork 890
New issue
Have a question about this project? Sign up for a free GitHub account to open an issue and contact its maintainers and the community.
By clicking “Sign up for GitHub”, you agree to our terms of service and privacy statement. We’ll occasionally send you account related emails.
Already on GitHub? Sign in to your account
[Feature Anywhere] Enable plugins to augment visualizations with additional data and context #2880
Closed
26 of 31 tasks
Labels
feature-anywhere
unified visualization UX
v2.9.0
visualizations
Issues and PRs related to visualizations
Comments
This was referenced Nov 18, 2022
This was referenced Dec 7, 2022
This was referenced Dec 22, 2022
This was referenced Dec 23, 2022
|
Alerting Meta task issue: opensearch-project/alerting-dashboards-plugin#457 |
|
Anomaly Detection meta task issue: opensearch-project/anomaly-detection-dashboards-plugin#400 |
|
Added both of those in description ^ |
This was referenced Feb 2, 2023
7 tasks
9 tasks
|
As called out: #3981 We will target this for v2.next for prioritization on Node upgrade. |
12 tasks
This was referenced Jul 12, 2023
This was referenced Jul 19, 2023
Sign up for free
to join this conversation on GitHub.
Already have an account?
Sign in to comment
Labels
feature-anywhere
unified visualization UX
v2.9.0
visualizations
Issues and PRs related to visualizations
Currently time series visualizations are limited in just showing raw results generated on-the-fly from configured metrics, and don't provide any additional insights about the data shown on the chart. There are several OpenSearch plugins that are tailored towards providing insights into time series data, including Anomaly Detection and Alerting.
To provide an easy way for users to gain more insights with their existing visualizations, as well as help improve visibility and adoption of these additional plugins, we propose a generic framework to allow plugin resources (e.g., anomaly detectors, alerting monitors) to be associated with visualizations, either via automatic generation based on a visualization itself, or existing plugin resources. Additionally, we can support overlaying these additional results on top of the visualization charts.
At a high level, this can be achieved through the following steps:
VisLayersinterface to support multiple ways of overlaying / augmenting data in a visualization chartvisliblibrary tovega-lite, to more easily process & render overlayed data onto the chartsfeature-anywheresaved object type to persist relationships between a plugin resource and a visualizationvis_layersexpression function type that can be used to process plugin data and convert into visualization overlay dataVisLayers to show on the chart canvasAll of these new components (Steps 2,4,5 from above) can be maintained and registered in a standalone
vis_augmenterplugin - see #2958 for details.Plugins can onboard to this framework by performing the following steps:
vis_layersexpression function to process their plugin data and convert into aVisLayer.augment-vissaved objects for persisting these relationships.Anomaly Detection and Alerting are the first 2 plugins that will be onboarding. Details can be found in their respective meta issues:
All related issues should be labeled with feature-anywhere
Progress tracker (core Dashboards)
augment-vissaved object type #2893 (PR)vis_layersexpression function type #2894 (PR)VisLayerdata models #3373 (PR)VisLayers when rendering visualization line charts #3122 (PR)VisLayers #3130 (PR)VisLayers #3267 (PR)VisLayererrors #3580 (PR)augment-vissaved objs #4044 (PR)Current bug tracker (meta issue):
Progress tracker (functional tests)
See https://github.com/opensearch-project/opensearch-dashboards-functional-test/issues?q=is%3Aissue+is%3Aopen+%5BFeature+Anywhere%5D
Future enhancement tracker (not part of initial release):
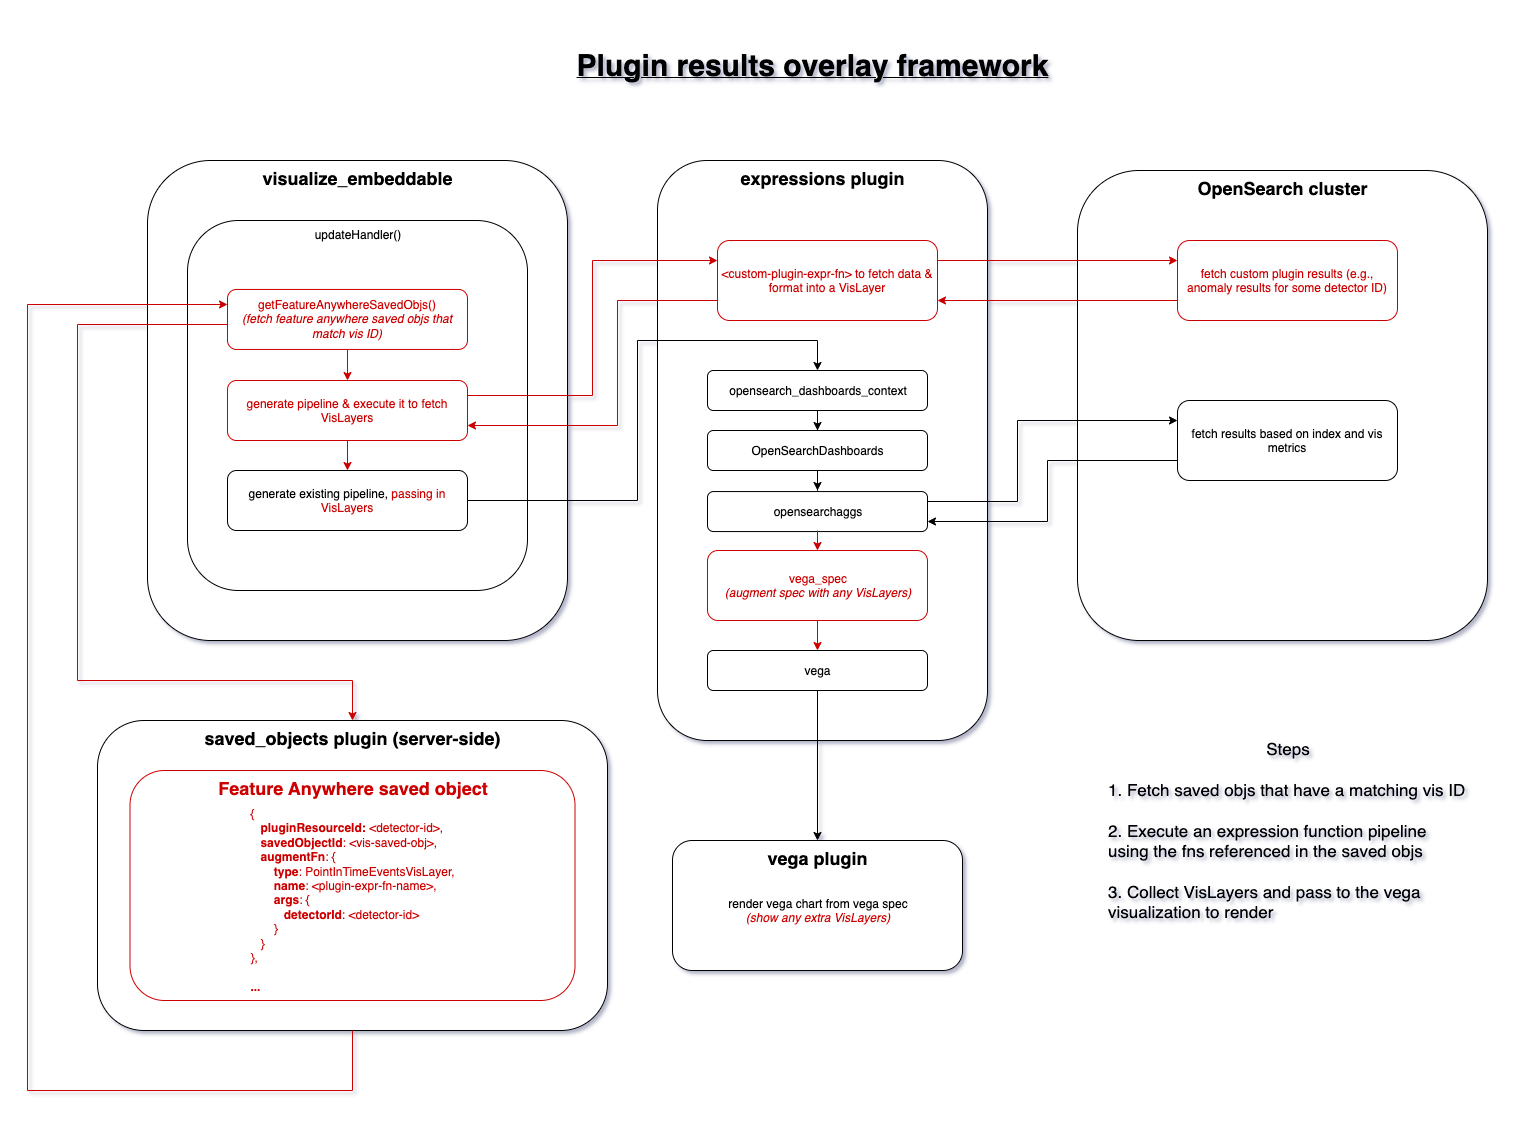
find()/findAll()for saved object loader #3566VisAugmenterdependencies aren't set sometimes #4138VisLayerflyouts #4180Below are some of the high-level designs describing this feature:

Fig 1: The visualization render workflow design (changes highlighted in red)
Fig 2: The user workflow design (changes highlighted in red):

Below are some of the proposed mockups, using the anomaly detection plugin as an example:
Fig 3: View overlayed data on a visualization chart

Fig 4: View registered plugins in the visualization options panel

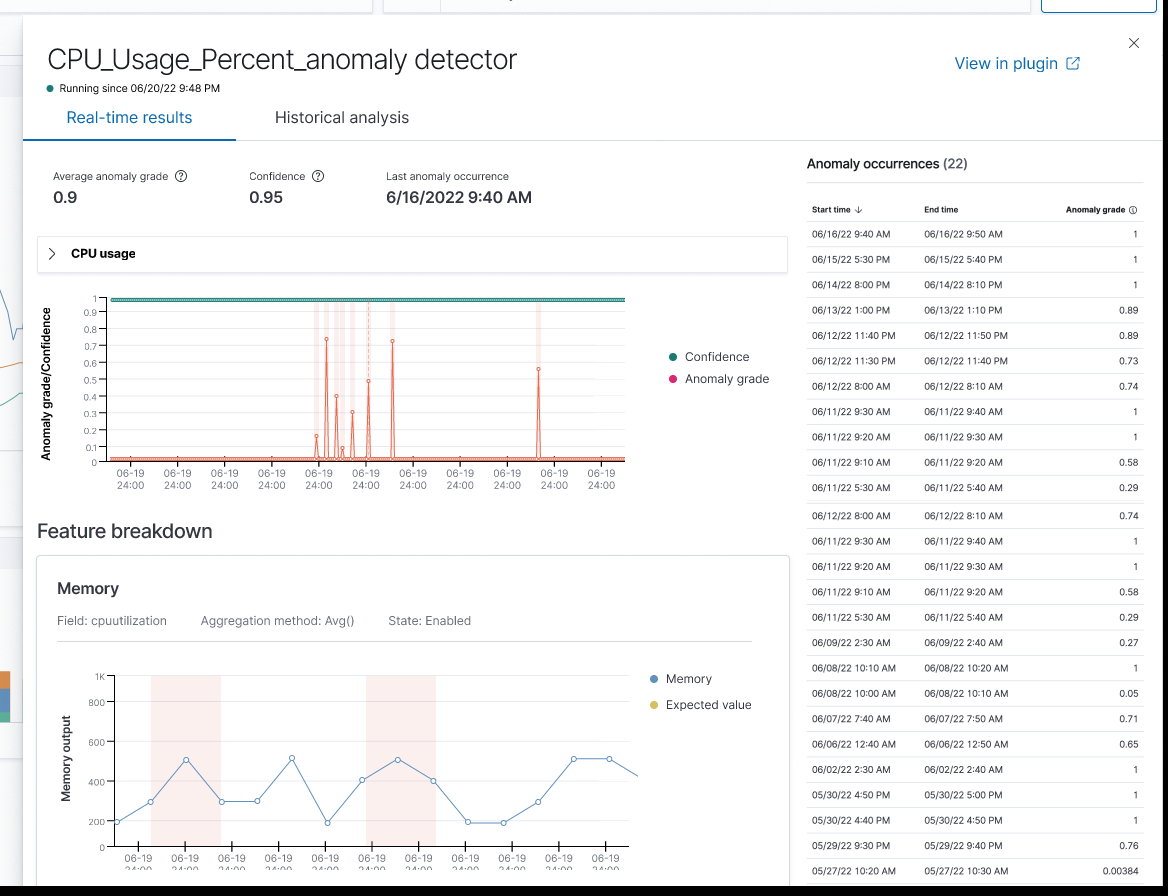
Fig 5: View details for the Anomaly Detection plugin

Fig 6: View details for a particular associated anomaly detector

The text was updated successfully, but these errors were encountered: