Releases: Open-Systems-Pharmacology/Suite
Version 11 Update 3
Downloads:
-
MD5-Hash SHA256-Hash 5da0e1b370941f5e6628401cdd0dce1e092ee97cb65f2259542409982e1c9041a8d58291fe5c7daed371d9b538642624
Release Notes for the Open Systems Pharmacology Software Suite 11 Update 3
New features
This is a pure bug fix and performance improvement release. No new features implemented.
Fixed issues and Improvements
PK-Sim
- Observed data mappings get duplicated when cloning a simulation
- Changing the transport direction in the expression profile is not applied in the simulation.
- Projects created with version
$\leq 10$ are sometimes not exported correctly to a snapshot with version$\geq 11$ . - Error displaying PK analysis in population simulation in some scenarios
- Create Individual: wrongly memorized age
- Unit of t1/2 in individual enzyme expression not updated when changing unit in expression profile
Concentrationparameter must be created withCanBeVaried = false
PK-Sim and MoBi
- Parameter identification: significant performance improvement when dealing with large number of observed data sets
- Performance improvement when handling charts with many displayed curves
- Crash in cloned parameter identification after project save/load
getAllParametersMatching()should append|*to each path that ends with|**.
New release of the ospsuite R package
No new features. New release only due to the changes in the embedded OSP libraries.
Version 12.0 beta 1
Downloads:
- Full setup
- Alternatively, download and unzip portable versions of PK-Sim and MoBi 12 beta
- ospsuite R package
- Gene expression database (human)
Version 12.0 alpha
Downloads:
Version 11 Update 2
Downloads:
-
MD5-Hash SHA256-Hash c43eb7042b505106e5f3a28d6a365f77eefc55d045eea26c8fc79b7cc98b00ced8a928dbd407a865ad83c4e305894175
Release Notes for the Open Systems Pharmacology Software Suite 11 Update 2
New features
This is a pure bug fix release. No new features implemented.
Fixed issues and Improvements
PK-Sim
- PK-Sim changes molecule name while importing a project from a snapshot file
- Projects created with <= V10 are sometimes not properly exported to snapshot with >= V11
- Loading project from snaphot: observed data which was previously added to a simulation is plotted but not added to the curves browser
- Number of cells/g tissue missing for monkey and minipig
MoBi
- MoBi cannot handle observed data sets with only 1 point anymore
- "Notifications": weird column "No image data"
PK-Sim and MoBi
New release of the ospsuite R package
No new features. New release only due to the changes in the embedded OSP libraries.
Version 11 Update 1
Downloads:
-
MD5-Hash SHA256-Hash 2fd429d4ae7bd57b1aefcbfc38b20e01dbb8703fc238d11ab0e5ef13aa81b15412809653270a0cf6bdf6a8230159d4c6
Release Notes for the Open Systems Pharmacology Software Suite 11 Update 1
New features
(*) Implementation of the features was sponsored by Boehringer Ingelheim Pharma GmbH & Co. KG
Mapping observed data sets to simulation outputs in individual simulations (*)
In simulations, the newly introduced Observed Data tab can be used to map observed data sets to the corresponding simulation outputs.
This mapping is required for some of the new features described below (e.g. for displaying goodness of fit, etc.).
All observed data sets belonging to the opened simulation are listed in the mapping table. When adding or removing an observed data set to/from the simulation, the table is updated. Newly added observed data sets are automatically mapped to simulation outputs according to Organ, Compartment and Molecule meta data of the data set and path elements of the outputs. If no matching output can be found, the mapped simulation output is set to None. This means that the specified observed data set is not mapped. The user can also clear an output mapping by selecting the None entry from the Output dropdown. By clicking the "x" on the right side of the grid, the user can delete the observed data from the simulation.
For each mapping, the scaling can be defined as Linear or Log which determines the residual calculation.
Scaling
| Linear | Residuals are calculated as: Simulation value - Observed value. This means that the residuals are defined by absolute differences. If the magnitudes of values are different for different parameters, the different magnitudes of residuals should be harmonized by corresponding weights (reciprocal values). |
| Log | Residuals are calculated as: log(Simulation value) - log(Observed value) = log (Simulation Value / Observed Value). This means that the ratio of values is considered which is independent of the magnitude of the value. |
To reflect the quality or importance of the observed data set, you can edit the weights of each mapping.
Predicted vs. Observed Chart in Simulations (*)
For each observed value a point is plotted with observed value as x-Value and corresponding simulated value as y-Value.
Adding Deviation Lines to the chart
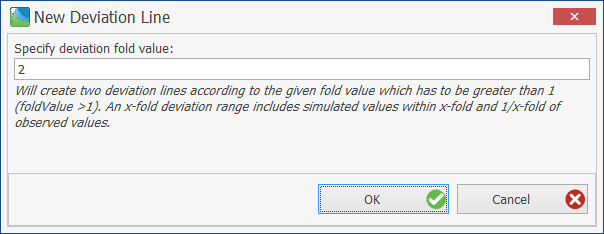
In a Predicted vs. Observed plot the user can right click on the chart and add deviation lines:
This opens a dialog where the user can specify the fold value of the deviation curves.
This will create two deviation lines according to the given x-fold value which has to be greater than 1. An x-fold deviation range includes simulated values within x-fold and 1/x-fold of observed values.
Residuals vs. Time Chart in Simulations (*)
This chart is similar to the Time Profile chart, but on the y-axis the (absolute) residuals are plotted. The chart includes scaling and weights.
At the top of the chart, the total residual error is displayed.
PK-Parameters in Population Simulations (*)
Before version 11 Update 1 pk parameters were only calculated for the selected outputs and were calculated based on the analyzed curve. For example, a mean curve was created and PK Values calculated once from that curve.
With the new release, population simulations contain new features for PK-analyses.
Global PK Analysis
Individual simulations prior to v11 update 1 have had a 'global' PK calculation done using venous blood curve.
This type of analysis was not previously available for population simulations. The global pk parameters for population simulation will show in a similar location to the individual simulation, with the caption indicating how the values are aggregated. They are calculated for all individuals in the population and the displayed value is the median of the individual values.
These newly available PK-parameters can also be used in the creation of other types of analysis. For example scatter analysis or box plot.
PK-parameters for range selections
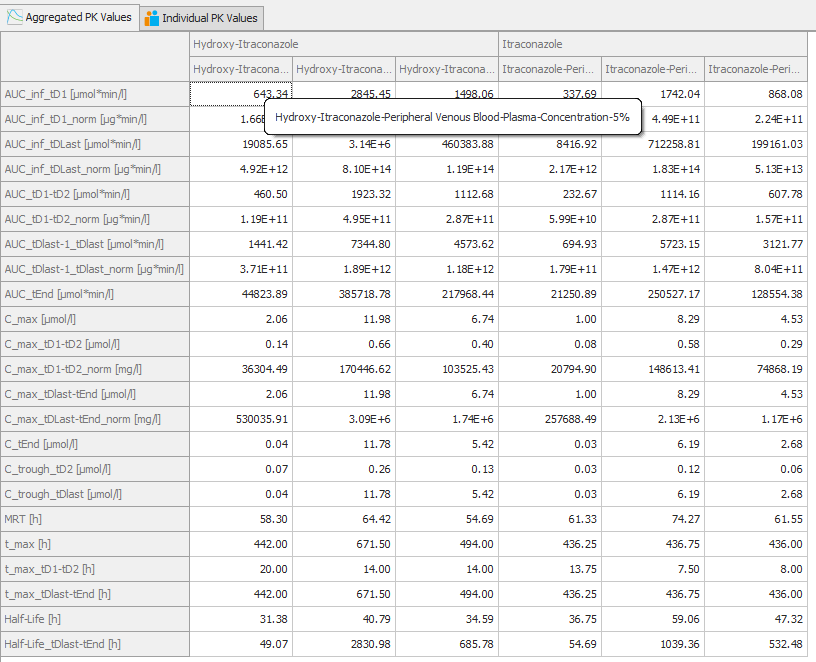
Now when you select a range analysis for your time profile (e.g. 5%-95%), Pk-parameters will be calculated for the upper and lower range.
Selecting Mean, and Range 5% to 95% as an example:
Generates PK-parameters for Mean, 5%, and 95% for each compound.
PK-Parameter Aggregation
Also apparent from the screenshot is that there are tabs which display Pk-Parameters aggregated in different ways.
In the tab shown above, 'Aggregated PK Values', PK Values are calculated from the analyzed curve. For example, the curve at the lower limit of the range 5% is used to calculate PK parameters.
Compared to the tab shown below, 'Individual PK Values' where PK Values are calculated for the individuals and then the median is shown.
Color grouping tab in the Chart Editor
A new tab called "Curves Color Grouping" has been introduced to the plots with observed data curves. In the tab the user can select one or more metadata, according to which the observed data sets will be grouped and given the same color. Clicking the “Apply Color Grouping” button changes the color of the observed data sets in the chart according to the selection, and then the selection is cleared. The user can then choose a new selection of metadata and change the coloring once again.
Editing options of multiple curves
In the “Curves and Axis Options” Tab of the Chart Editor a new context menu item has been added called “Edit options for selected”. It is only visible when the user has selected at least two rows.
Selecting this option opens a new dialog that lists the common options of the curves. Initially the values for the options are not set, and if the user lets any of the options to that initial state, that option will not be edited – meaning that the selected curves will retain for that option the value they had before opening the dialog.
Grouping of results in the Chart Editor
In the result charts of Simulations and Parameter Identifications (Time Profile, Predicted vs. Observed, Residuals vs. Time) the curves in the Chart Editor are grouped according to their Category. Additionally the checkbox "Link Data to Simulations has been added". When activated, (un)selecting a simulation curve will also unselect the mapped observed data.
Running multiple Parameter Identifications in parallel in PK-Sim and MoBi
It is now possible to run multiple Parameter Identifications in parallel. After starting at least one PI, the ribbon bar “Run & Analyze” should reflect the state of the currently selected PI, instead of being equal for all PI instances as it was till now.
OSP Platform qualification library and PBPK Models Library
PBPK Models library extended
New PBPK models added:
- Carbamazepine
- Felodipine
- Sildenafil
Model building process and model quality of every new PBPK model is documented in the c...
Version 11.0
Downloads:
-
Full setup
(MD5-Hash:40231715122fdef240e9f3ec8cc2f941; SHA256-Hash:82f97ff4fe7948cd8c89cfd20e33fdc76eeb7f87fc633da1f6f19eba34098ae7)
Release Notes for the Open Systems Pharmacology Software Suite 11
New features
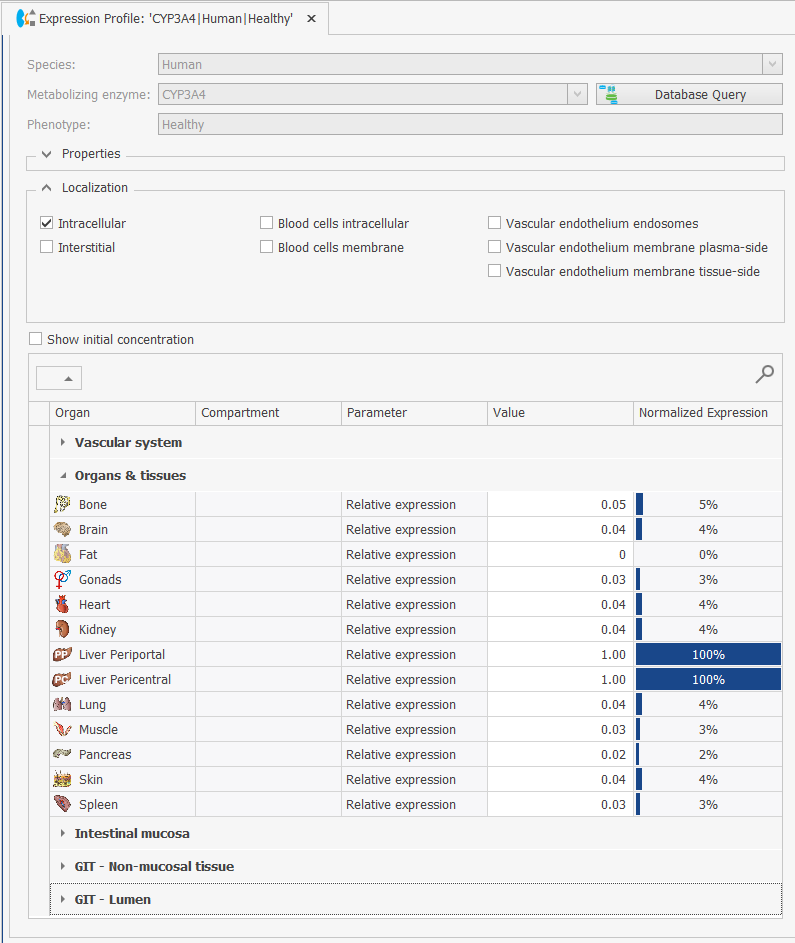
Expression Profile as standalone building block
Until PK-Sim version 10, expression profiles could only be created within an individual or a population.
Starting with the version 11, expression profiles can be created independently (like all other building blocks) and thus can be reused in different individuals/populations.
For the details s. the documentation
Building block templates in PK-Sim can be downloaded directly from the OSP GitHub site
OSP Platform qualification library and PBPK Models Library
PBPK Models library extended
New PBPK models added:
OSP Qualification reports library extended
New Qualification reports added:
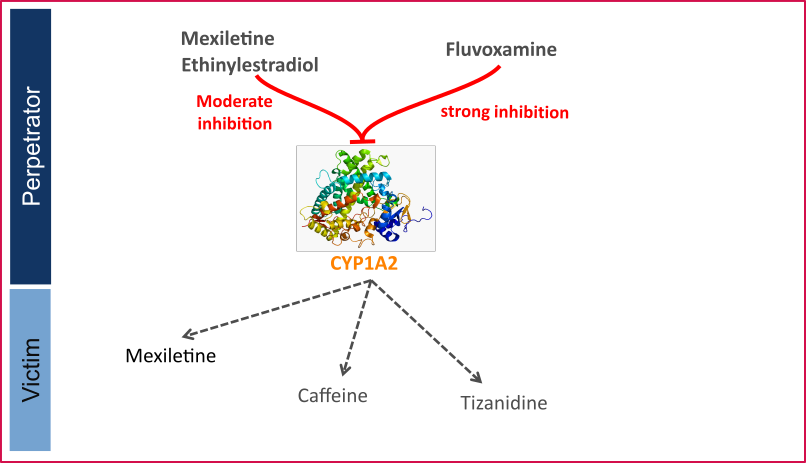
- CYP1A2 DDI
This qualification report evaluates the developed PBPK drug-drug interactions (DDI) models network for the ability to perform simulations with the intended purpose to predict cytochrome P450 1A2 (CYPA12)-mediated DDI.
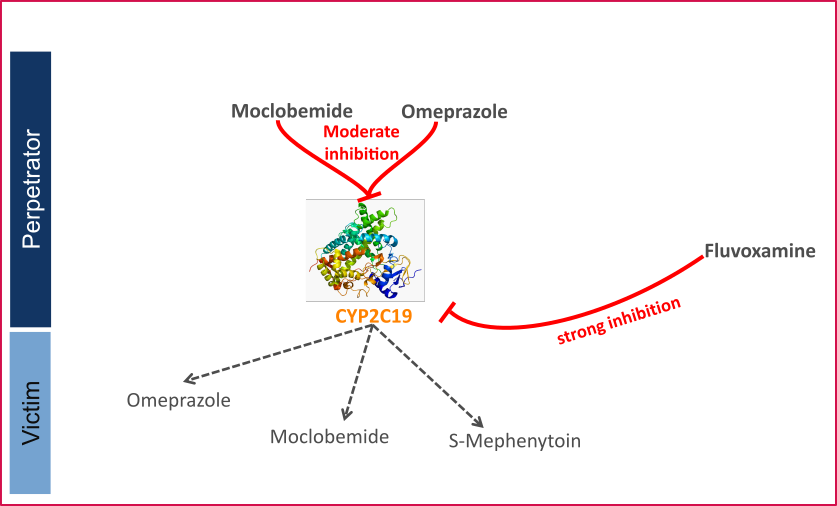
- CYP2C19 DDI
This qualification report evaluates the developed PBPK drug-drug interactions (DDI) models network for the ability to perform simulations with the intended purpose to predict cytochrome P450 2C19 (CYP2C19)-mediated DDI.
Model building process and model quality of every new PBPK model is documented in the corresponding model evaluation report.
New releases of OSP Platform qualification library and PBPK Models Library
As with every new OSP Suite release, ALL platform qualification reports and model evaluation reports have been recreated with the new version of the OSP Suite and the latest version of the OSP Qualification Framework:
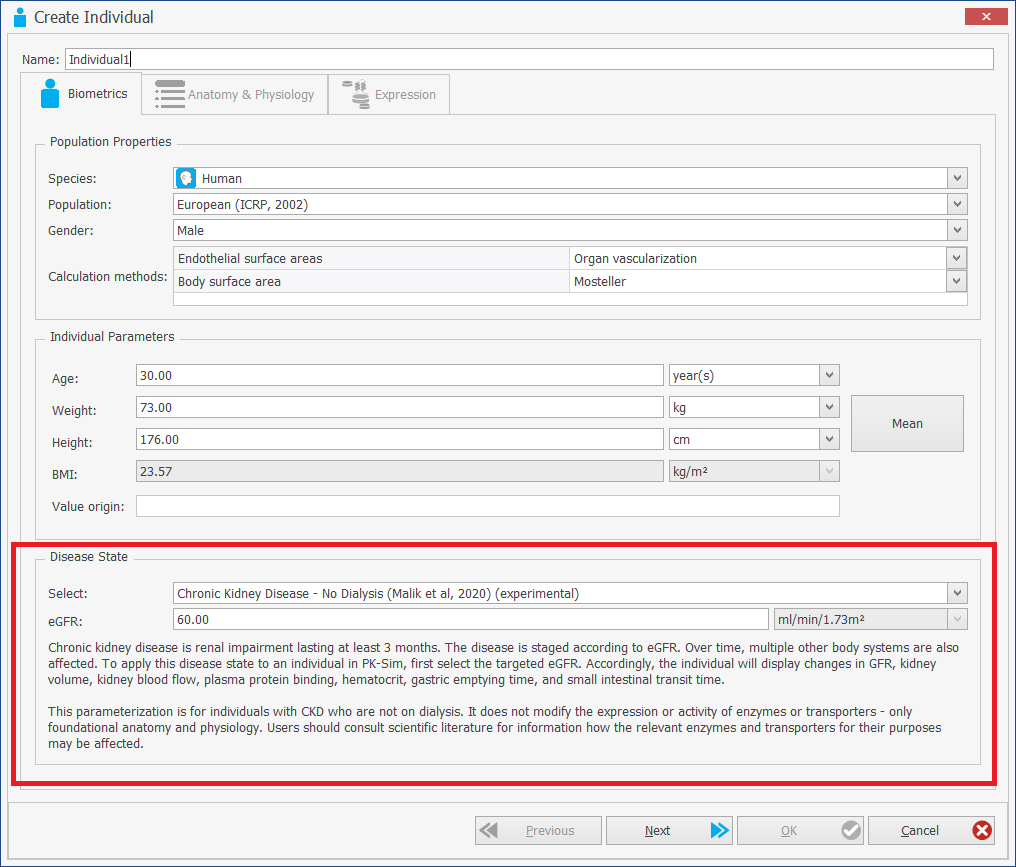
[Experimental!] Creating individuals and populations with CKD (Chronic Kidney Disease)
Already in version 10 of the software it was possible to use predefined CKD templates (based on the publication Malik PRV, Yeung CHT, Advani U, Dije S, Edginton AN. A Physiological Approach to Pharmacokinetics in Chronic Kidney Disease. J Clin Pharmacol 2020. 60 Suppl 1: S52-S62. doi: 10.1002/jcph.1713).
With version 11, CKD individuals and populations can now be created dynamically.
When creating an individual, a new option "Disease State" is provided, which allows a selection between Healthy and diseased individuals.
For the details s. the documentation and the original publication by Malik et al.
[Experimental!] New preclinical species
Two new preclinical species were added: Cat and Cattle.
The validation of the new species is not fully finalized yet, so both species are provided as an experimental version.
Cattle models can be used with IV applications only.
Extension of Container Criteria in MoBi
Container Criteria can be concatenated now not only by AND but also by OR operator
This extension is particularly used for the newly introduced Container Criteria of local molecule parameters
Color group observed data when drag and dropping folders to charts
When adding data sets via drag-and-drop of a folder (or multiple folders), all data sets within one folder can be assigned to a single color. This behavior is optional and can be changed by a setting integrated into the context menu of the “Observed Data” entry of the building blocks explorer. This setting is valid for all subfolders.
Alternatively, this feature can be toggled on and off from the User Settings:
- PK-Sim: under “Utilities” -> “Options” -> “General” -> “Colors”
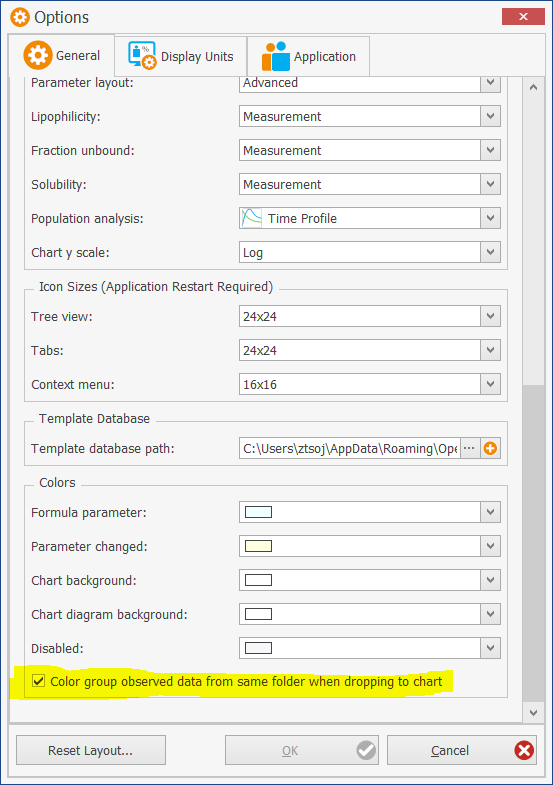
- MoBi: under “Utilities” -> “Options” -> “Chart Options”

Also, in case the user selects individual observed data sets instead of folders and drags and drops them on the plot, then each one should be assigned a new color, and they should not be grouped according to the folder they belong to.
High Screen Resolution Support
Users reported some issues with the layout of PK-Sim or MoBi when using custom font scaling on 4k monitors (or screen with high resolutions). Some UI elements were hidden, some icons were blurry, some text hard to read etc. The version 11 of PK-Sim and MoBi should address these issues and the tools should now behave as expected, even when using custom font scaling.
New release of the ospsuite R package
- Many Fixed issues and Improvements (s. the ospsuite R package news page and the ospsuite R package release page for details)
- Major new features:
-
Adds new
DataCombinedclass that combines observed data (DataSet) and
simulated data (SimulationResults) into a single object. Especially
important is the$toDataFrame()method of this object that returns a data
frame containing combined data from observed and simulated data, which can be
further used for visualizations or other analysis. -
Adds new visualization functions:
plotIndividualTimeProfile()andplotPopulationTimeProfile()to create
time-profile plots.
-
Adds a new class
DefaultPlotConfigurationto provide plot configurations for
plotting functions. -
Adds
simulationResultsToDataFrame()function to convertSimulationResults
objects into a data frame. -
All
*ToDataFrame()functions also get*ToTibble()variants to extract a
tibble data frame instead of a classical data frame.
-
S. documentation of the ospsuite R package for detailed description and usage examples.
(Re-)Qualification framework updated
OSP (Re-)Qualification framework is a technical framework to assess the confidence of specific intended use of the OSP platform. This framework allows for an automatic (re)-qualification workflow of the OSP suite.
- (Re-)Qualification framework is not part of the OSP Suite setup (is only required for the creation of qualification reports) and must be installed separately. The latest release can be found here
- Full documentation of the (Re-)Qualification framework can be found [here](https://docs.open-systems-pharmacology...
Version 10
Downloads:
Release Notes for the Open Systems Pharmacology Software Suite 10
New features
New population templates (Chronic Kidney Disease) added
3 CKD population templates added (based on the publication Malik PRV, Yeung CHT, Advani U, Dije S, Edginton AN. A Physiological Approach to Pharmacokinetics in Chronic Kidney Disease. J Clin Pharmacol 2020. 60 Suppl 1: S52-S62. doi: 10.1002/jcph.1713):
- CKD - Stage 3: defined as patients with GFR of
31 - 60 [mL/min/1.73m²] - CKD - Stage 4: defined as patients with GFR of
16 - 30 [mL/min/1.73m²] - CKD - Stage 5: defined as patients with GFR of
1 - 15 [mL/min/1.73m²]
Each population includes 1000 individuals aged 18-80 years old, 50% male, based on European population (ICRP)
OSP Platform qualification library and PBPK Models Library
PBPK Models library extended
New PBPK models added:
- Amikacin
- Fluconazole
- Montelukast
- Raltegravir
- Sufentanil
- Vancomycin
Model building process and model quality of every new PBPK model is documented in the corresponding model evaluation report.
New releases of OSP Platform qualification library and PBPK Models Library
As with every new OSP Suite release, ALL platform qualification reports and model evaluation reports have been recreated with the new version of the OSP Suite and the latest version of the OSP Qualification Framework:
Modeling of Protein expressions in PK-Sim redesigned and extended
See the documentation for details.
- More flexible protein localization settings
- Enzymes/Binding partners: introduction of fraction expressed in different compartments
- Transporters: introduction of fraction expressed apical/basolateral (Kidney/Liver/GI) and fraction expressed blood brain barrier/tissue (brain)
- Introduction of Initial Protein Concentration as explicit parameter
See Localizations and initial concentrations of enzymes and Localizations, directions, and initial concentrations of transport proteins for detailed descriptions.
-
New transporter types:
- Plasma <=> Blood Cells
- Plasma <=> Interstitial
- Bidirectional
-
Transport direction (Influx/Efflux/Bidirectional/Pgp) can be set in each organ independently
Observed data import in PK-Sim and MoBi redesigned and extended
See the documentation for details.
-
Better support for "Nonmem-like" data formats (s. Supported Formats)
-
Fully redesigned user interface
-
Import configuration can be saved and reused
-
Previously imported observed data can be updated from a new data source
-
Extended data filtering
InVitro-InVivo calibration of intestinal permeability
S. Intestinal Permeability Calibration for details.

New release of the ospsuite R package
- Many Fixed issues and Improvements (s. the ospsuite R package news page and the ospsuite R package release page for details)
- Significantly improved performance on multicore machines (s. Efficient calculation with the ospsuite R package)
- R 4.x is now supported.
S. documentation of the ospsuite R package for detailed description and usage examples.
(Re-)Qualification framework updated
OSP (Re-)Qualification framework is a technical framework to assess the confidence of specific intended use of the OSP platform. This framework allows for an automatic (re)-qualification workflow of the OSP suite. New release of the OSP (Re-)Qualification framework provides some improvements and bugfixes (s. below).
- (Re-)Qualification framework is not part of the OSP Suite setup (is only required for the creation of qualification reports) and must be installed separately. The latest release can be found here
- Full documentation of the (Re-)Qualification framework can be found here
Fixed issues and Improvements
PK-Sim
- Bug comparison chart population
- Plots: Default background color does not match
- Deleting referenced compound template corrupts the template database
- Simulations cannot be loaded from snapshot if used Individual or Population Building block was renamed
- Export time profile analysis change the units
- Renaming protein in individual does not trigger changed state of simulation
- Information in advanced protocol is lost in snapshot
- Wrong parameter descriptions
- The predefined templates for age groups are not supported anymore
- PI: "Id not unique"
- Bug: Drug and Metabolite transporter inhibition
MoBi
- Tags for event groups
- Manual input for event assignment path
- Container criteria "in container" only applies for the children of the container
- Molecule keyword replacement does not work for global parameter referencing other global molecule parameters
- Drag and drop of parameter to the "references area" does not work
PK-Sim and MoBi
Version 9 Update 1
Downloads:
-
(Re-)Qualification framework
(Optional OSP Suite components which are only required for the creation of qualification reports.)
Release Notes for the Open Systems Pharmacology Software Suite 9 Update 1
New features
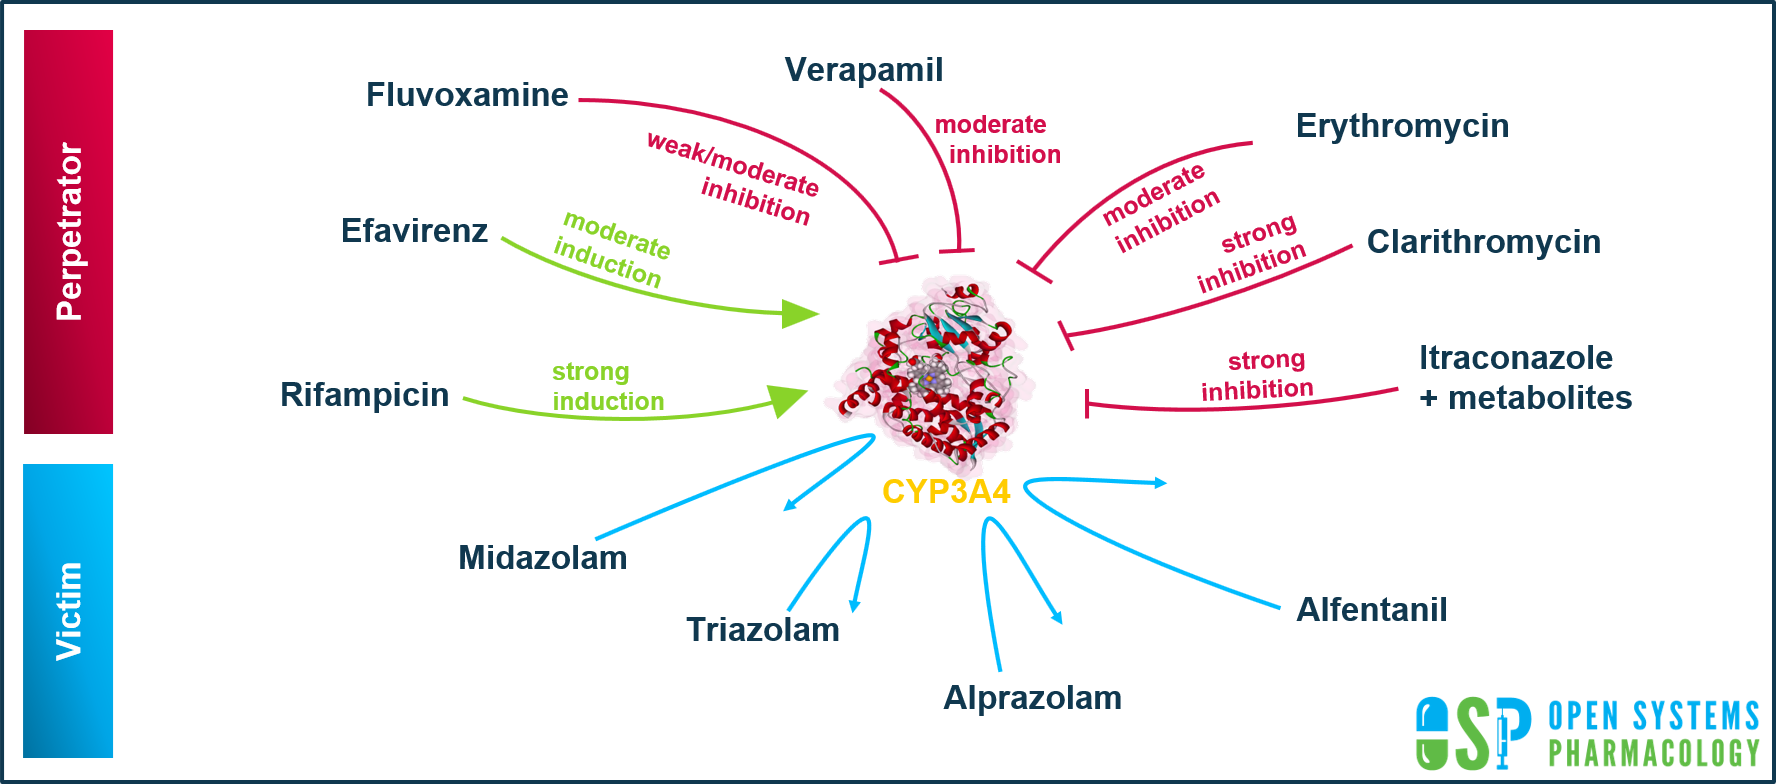
OSP Platform qualification library extended with CYP3A4 DDI Qualification report
This qualification report evaluates for the PBPK platform PK-Sim (as part of the OSP Suite) the ability to perform simulations with the intended purpose to predict cytochrome P450 3A4 (CYP3A4)-mediated drug-drug interactions (DDI).
To demonstrate the level of confidence, the predictive performance of the platform for this indented purpose is assessed via a network of PBPK models of selected index CYP3A4 DDI perpetrators (covering the range from strong induction to strong inhibition), and respective sensitive index CYP3A4 victim drugs and a comprehensive dataset from published clinical DDI studies. All PBPK models represent whole-body PBPK models, which allow dynamic DDI simulations in organs expressing CYP3A4.
This and other OSP qualification reports can be found in the OSP Qualification Reports library (https://github.com/Open-Systems-Pharmacology/OSP-Qualification-Reports)
PBPK Models Library extended
Many new PBPK models were added. Model building process and model quality of every new PBPK model is documented in the corresponding model evaluation report.
New models and model evaluation reports can be found in the OSP-PBPK-Model-Library (https://github.com/Open-Systems-Pharmacology/OSP-PBPK-Model-Library)
Redesigned and extended R-Toolbox
The R-Toolbox allows the processing of the OSP models in R. Previously available R-Toolbox was fully redesigned and extended with many new features, enabling:
- loading, manipulating (changing parameter and molecule start values), and simulating the models created in the OSP platform
- loading and simulating virtual populations
- creating user defined PK parameters not available in PK-Sim/MoBi out of the box
- creating virtual individuals and populations
- performing sensitivity analysis of PK parameters
- reintegration of modified models back into PK-Sim/MoBi
- availability under Windows and Linux
- utilizes the concept of object oriented (OO) programming based on the R6 system.
- does not require full installation of the OSP Software Suite (except for creation of individuals/populations)
S. documentation of the new R-Toolbox for detailed description and usage examples.
(Re-)Qualification framework updated
OSP (Re-)Qualification framework is a technical framework to assess the confidence of specific intended use of the OSP platform. This framework allows for an automatic (re)-qualification workflow of the OSP suite. New release of the OSP (Re-)Qualification framework provides some improvements and bugfixes (s. below).
- (Re-)Qualification framework is not part of the OSP Suite setup (is only required for the creation of qualification reports) and must be installed separately. The latest release can be found here
- Full documentation of the (Re-)Qualification framework can be found here
Important note
Starting with the OSP Suite Release 9 Matlab-Toolbox development and support is stopped.
However it is still possible to use the latest available Matlab-Toolbox with PK-Sim and MoBi.
Instructions are given in this wiki
Fixed issues and Improvements
Qualification framework
- Added support for user-defined observers
- Improved markdown creation
- Fixed corrupted image paths
- Added an option to specify sub plots of a ddi ratio plot
- Fixed:
plotQualificationComparisonTimeProfilethrows an error if observed data is empty - Fixed: default axes calculations for ddi ratio plots leads to uncommon plots in certain cases
- Fixed: In case of
observation n=1AUCR and CmaxR are mixed - Fixed: Range in time profile plots
- Added: Pediatrics Ratio-plots grouping option (split by color and symbol)
PK-Sim and MoBi
- Fixed: Visual Feedback shows identical values for Best and Current
- Fixed: Copy to clipboard of graph broken on screen with 150% scaling
- Fixed: Memory Leak in aging simulations
PK-Sim
- Plot of dissolution kinetics should rather be linear scaled
- Support for dimension generated by MoBi automatically
- Icon for individual should be set to species icon and not species name
- Fixed: Cannot confugure or clone a simulation after renaming of an administration protocol
- Fixed: Deactivated processes activated after reimport from snapshot
- Fixed: Error importing from a snapshot
- Fixed: User defined observers are not exported to snapshot and re-imported from snapshot
- Fixed: Crash when loading a PI recreated from snapshot
- Fixed: Context menu "Delete all subfolders and data" for "Comparisons" without function
- Fixed: Observed data error
- Fixed: Export/re-load of snapshot: transparency settings of colors is lost
- Fixed: Export to snapshot / reimport in PK-Sim alters protein reference concentration
- Fixed: Unable to open parameter optimization
- Fixed: PI is corrupted when referencing a process parameter that is removed from the simulation
- Fixed: AUCR and CmaxR wrong calculated in PL-Analysis if dose is changed in Simulation parameters
- Fixed: Issue when exporting snapshot with changed building block parameters in simulations
- Fixed: Wrong interaction factor
MoBi
Version 9
Downloads:
-
(Re-)Qualification framework
(Optional OSP Suite components which are only required for the creation of qualification reports.)
Release Notes for the Open Systems Pharmacology Software Suite 9
New features
OSP Platform qualification library extended with CYP3A4 DDI Qualification report
This qualification report evaluates for the PBPK platform PK-Sim (as part of the OSP Suite) the ability to perform simulations with the intended purpose to predict cytochrome P450 3A4 (CYP3A4)-mediated drug-drug interactions (DDI).
To demonstrate the level of confidence, the predictive performance of the platform for this indented purpose is assessed via a network of PBPK models of selected index CYP3A4 DDI perpetrators (covering the range from strong induction to strong inhibition), and respective sensitive index CYP3A4 victim drugs and a comprehensive dataset from published clinical DDI studies. All PBPK models represent whole-body PBPK models, which allow dynamic DDI simulations in organs expressing CYP3A4.
This and other OSP qualification reports can be found in the OSP Qualification Reports library (https://github.com/Open-Systems-Pharmacology/OSP-Qualification-Reports)
PBPK Models Library extended
Many new PBPK models were added. Model building process and model quality of every new PBPK model is documented in the corresponding model evaluation report.
New models and model evaluation reports can be found in the OSP-PBPK-Model-Library (https://github.com/Open-Systems-Pharmacology/OSP-PBPK-Model-Library)
Redesigned and extended R-Toolbox
The R-Toolbox allows the processing of the OSP models in R. Previously available R-Toolbox was fully redesigned and extended with many new features, enabling:
- loading, manipulating (changing parameter and molecule start values), and simulating the models created in the OSP platform
- loading and simulating virtual populations
- creating user defined PK parameters not available in PK-Sim/MoBi out of the box
- creating virtual individuals and populations
- performing sensitivity analysis of PK parameters
- reintegration of modified models back into PK-Sim/MoBi
- availability under Windows and Linux
- utilizes the concept of object oriented (OO) programming based on the R6 system.
- does not require full installation of the OSP Software Suite (except for creation of individuals/populations)
S. documentation of the new R-Toolbox for detailed description and usage examples.
(Re-)Qualification framework updated
OSP (Re-)Qualification framework is a technical framework to assess the confidence of specific intended use of the OSP platform. This framework allows for an automatic (re)-qualification workflow of the OSP suite. New release of the OSP (Re-)Qualification framework provides some improvements and bugfixes (s. below).
- (Re-)Qualification framework is not part of the OSP Suite setup (is only required for the creation of qualification reports) and must be installed separately. The latest release can be found here
- Full documentation of the (Re-)Qualification framework can be found here
Important note
Starting with the OSP Suite Release 9 Matlab-Toolbox development and support is stopped.
However it is still possible to use the latest available Matlab-Toolbox with PK-Sim and MoBi.
Instructions are given in this wiki
Fixed issues and Improvements
Qualification framework
- Added support for user-defined observers
- Improved markdown creation
- Fixed corrupted image paths
- Added an option to specify sub plots of a ddi ratio plot
- Fixed:
plotQualificationComparisonTimeProfilethrows an error if observed data is empty - Fixed: default axes calculations for ddi ratio plots leads to uncommon plots in certain cases
- Fixed: In case of
observation n=1AUCR and CmaxR are mixed - Fixed: Range in time profile plots
- Added: Pediatrics Ratio-plots grouping option (split by color and symbol)
PK-Sim and MoBi
- Fixed: Visual Feedback shows identical values for Best and Current
- Fixed: Copy to clipboard of graph broken on screen with 150% scaling
- Fixed: Memory Leak in aging simulations
PK-Sim
- Plot of dissolution kinetics should rather be linear scaled
- Support for dimension generated by MoBi automatically
- Icon for individual should be set to species icon and not species name
- Fixed: Cannot confugure or clone a simulation after renaming of an administration protocol
- Fixed: Deactivated processes activated after reimport from snapshot
- Fixed: Error importing from a snapshot
- Fixed: User defined observers are not exported to snapshot and re-imported from snapshot
- Fixed: Crash when loading a PI recreated from snapshot
- Fixed: Context menu "Delete all subfolders and data" for "Comparisons" without function
- Fixed: Observed data error
- Fixed: Export/re-load of snapshot: transparency settings of colors is lost
- Fixed: Export to snapshot / reimport in PK-Sim alters protein reference concentration
- Fixed: Unable to open parameter optimization
- Fixed: PI is corrupted when referencing a process parameter that is removed from the simulation
- Fixed: AUCR and CmaxR wrong calculated in PL-Analysis if dose is changed in Simulation parameters
- Fixed: Issue when exporting snapshot with changed building block parameters in simulations
MoBi
Version 8
Downloads:
-
The following (optional) OSP Suite components are only required for the creation of qualification reports
-
Reporting engine. There are 2 installation options:
- alternative no. 1: install as Matlab source code library.
- Matlab installation (version 2017b or later) is required
- alternative no. 2(Experimental!!): install as compiled library.
- Free Matlab Compiler Runtime version 2017b must be installed (download it here)
- Adjust CreateQualificationReport.bat (s. comments in the file)
- Adjust QualificationWorkflow.m and start from command line via
CreateQualificationReport.bat QualificationWorkflow.m
- alternative no. 1: install as Matlab source code library.
Release Notes for the Open Systems Pharmacology Software Suite 8
Important note – read BEFORE installation
User Template Database migration from 7.3 (and below) to 7.4 and above
New features
(Re-)Qualification framework
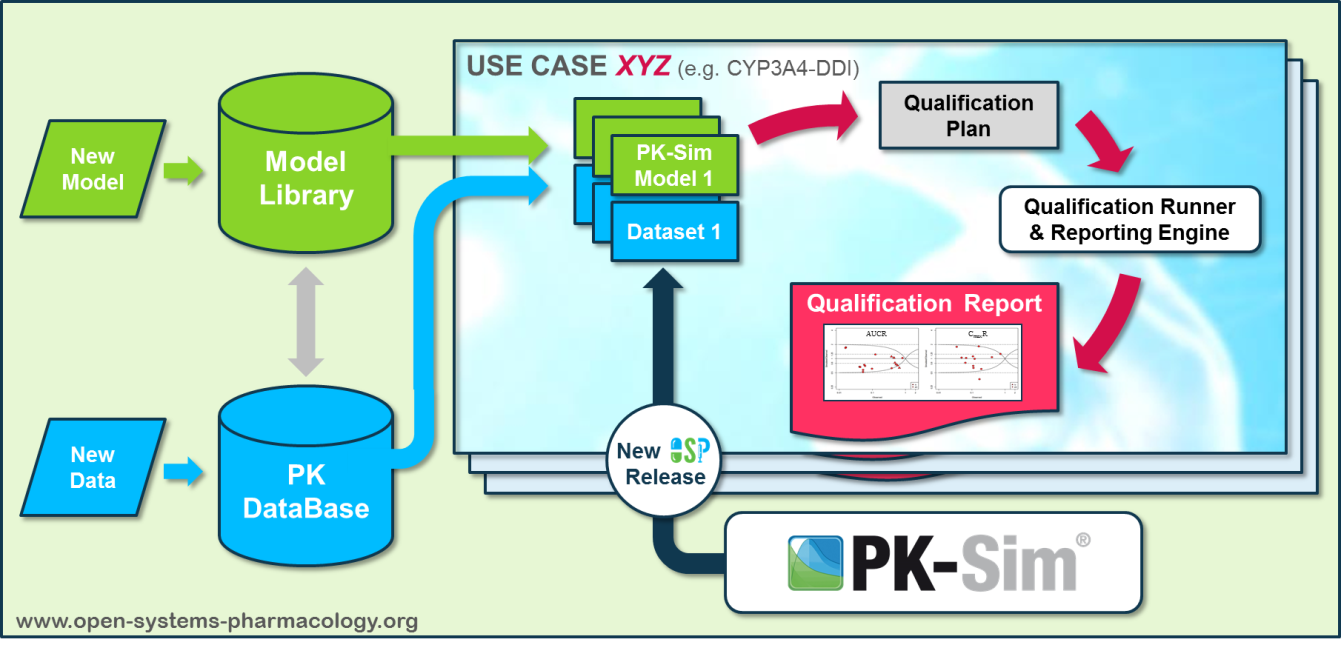
A technical framework to assess the confidence of specific intended use of the OSP platform was developed (qualification runner and reporting engine). This framework allows for an automatic (re)-qualification workflow of the OSP suite, comprising the following steps:
- PBPK model development and verification with observed data
- Qualification plan generation
- Qualification report generation
In a first step, the respective qualification scenario is saved in a special qualification repository on GitHub. This qualification scenario repository contains a detailed qualification plan that links and combines respective models and data to address the use case that shall be qualified. Therefore, the qualification plan consists of:
- PK-Sim project files (more precisely: PK-Sim project file snapshots)
- Description of potential cross-dependencies between PK-Sim project files (if adequate) (e.g. it is possible to inherit building blocks or simulation parameters)
- Observed data sets (needed for model development and verification)
- Qualification scenario description text modules
- Detailed report settings to describe the generation of charts and qualification measures.
PK-Sim projects, observed data sets, and qualification scenario text modules can, but not necessarily have to, be saved in their own/different repositories and then conveniently be referenced by the qualification plan.
In the next step, the Qualification Runner (stand-alone tool) processes the qualification plan, i.e. all project parts are exported and prepared for the Reporting Engine. The Reporting Engine provides a validated environment (currently implemented in MATLAB®, a transfer to R is in development) for model execution and generates tables and figures for the final qualification report. This report contains the evaluation of the individual PBPK models with observed data (i.e. standard goodness of fit plots, visual predictive checks) and a comprehensive qualification of the specific use case assessing the predictive performance of the OSP suite by means of a predefined set of qualification measures and charts.
The automated execution of the described workflow can be triggered to assess re-qualification in case new data, changes in model structure or parameterization, or new OSP suite releases arise.
Supersaturation
Supersaturation, i.e. the concentration increase of a solution beyond its saturation, can now be simulated for the formulation type particle dissolution. The parameter can be found in the Advanced Parameters Tab of the Compound Building Block. If activated, the effective compound concentration in the intestinal lumen can exceed the solubility defined in the compound. The default value of this new parameter is false meaning that supersaturation is inactivated.
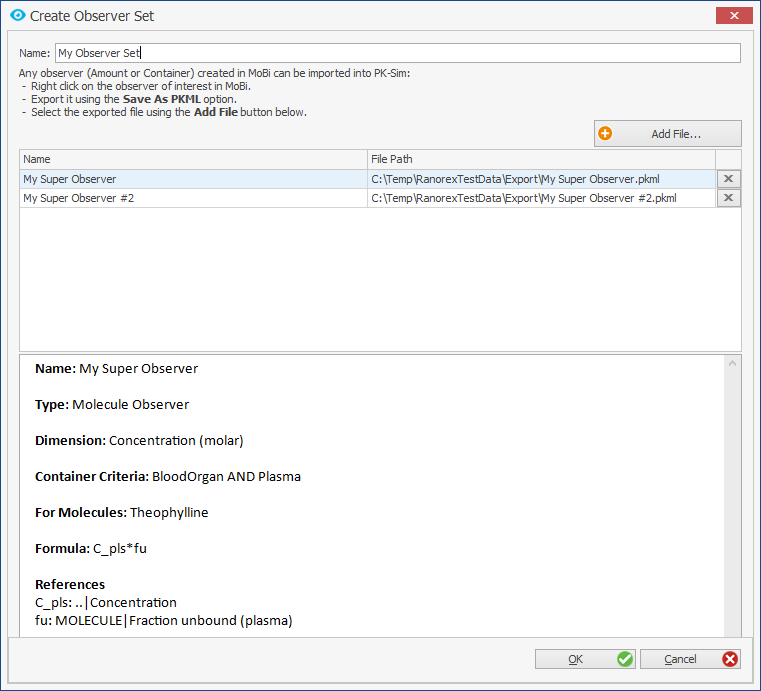
Observer in PK-Sim
Now it is possible to add custom observers in PK-Sim. Workflow for this:
- Create observer in MoBi and export it to PKML
- Add new Observer Building Block in PK-Sim
4. Add observers during simulation creation
5. Select observers of interest as outputs
Combination of user defined administrations with advanced protocols
Calculation of the Total fraction metabolized
In the past fraction of metabolized dose could be plotted per compartment only.
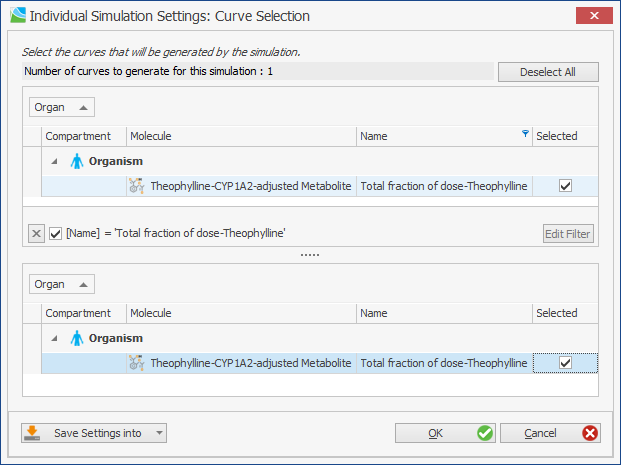
Now it is also possible to show the total fraction metabolized (= sum of fraction metabolized over all compartments). It can be found under Organism/Total fraction of dose - <Compound name>
Fixed issues and Improvements
PK-Sim and MoBi
- Parameter Identification: allow multiple mapping of observed data sets
- Parameter Identification: dublicate names possible when cloning
- Fixed parameters flag is not included in the Parameter Identification export
PK-Sim
- Figure in Formulation BB displaying Fraction dissolved has cropped x-axis title
- Cannot load population from CSV anymore
- Error recreating a popualtion simulation from snapshot
- Expression databse on share drive: sometimes, user can't open the file
- Transporter location disappears sometimea (Indiviudal Building Block)
- Names of parameters from Parameter Identification are exported to snapshot but not re-imported
- Parameter Identification: Error message for maximum value of meal energy content not clear
- Refresh problem: deleted curves remain in chart
- Error in comparison of compounds: e.g. differences of defaults are not displayed
- Working Journal name not displayed in the status line after project reloading
MoBi
- (Re-)configuration of existing simulations
- Enable Sum Formula tag "within container"
- Improve sum formula


