


Welcome to my gallery of Snap Changelogs.
You can set up your own Snap Changelog -- free for your first three repos -- over at GitClear.
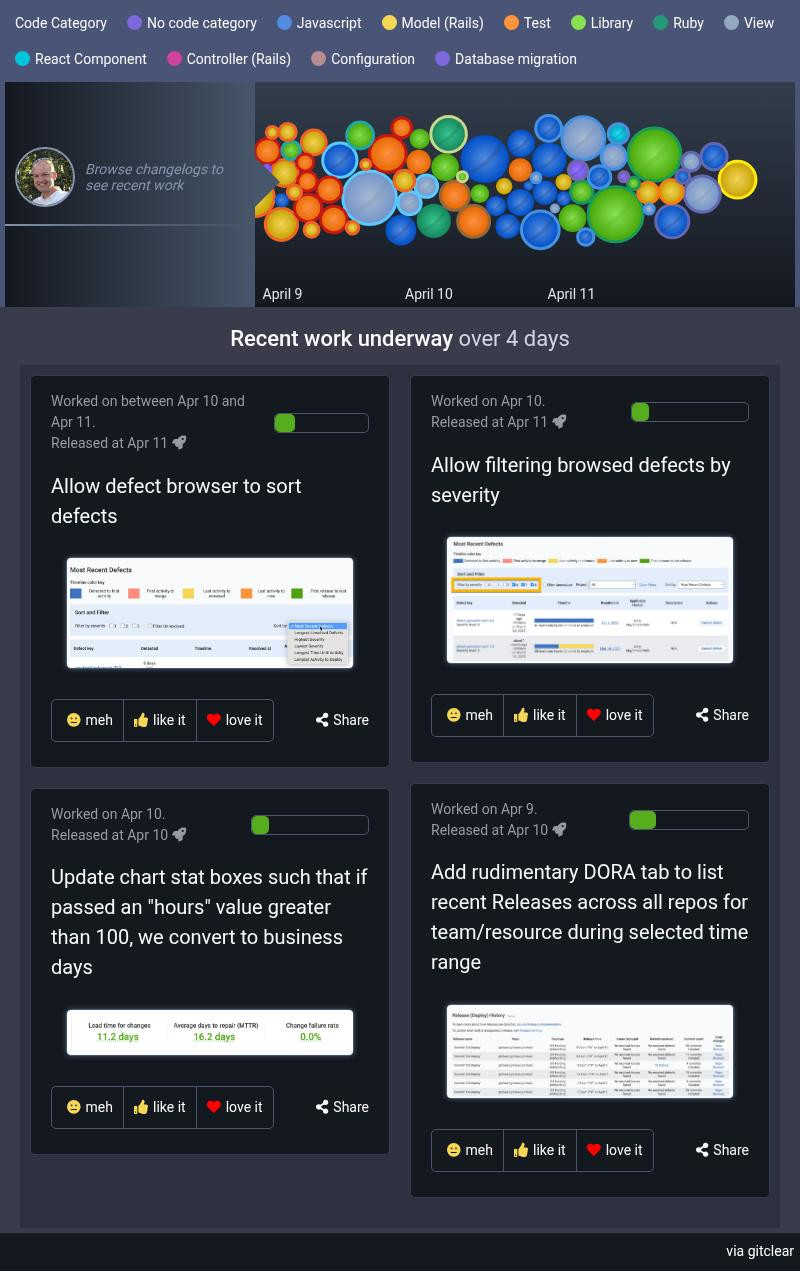
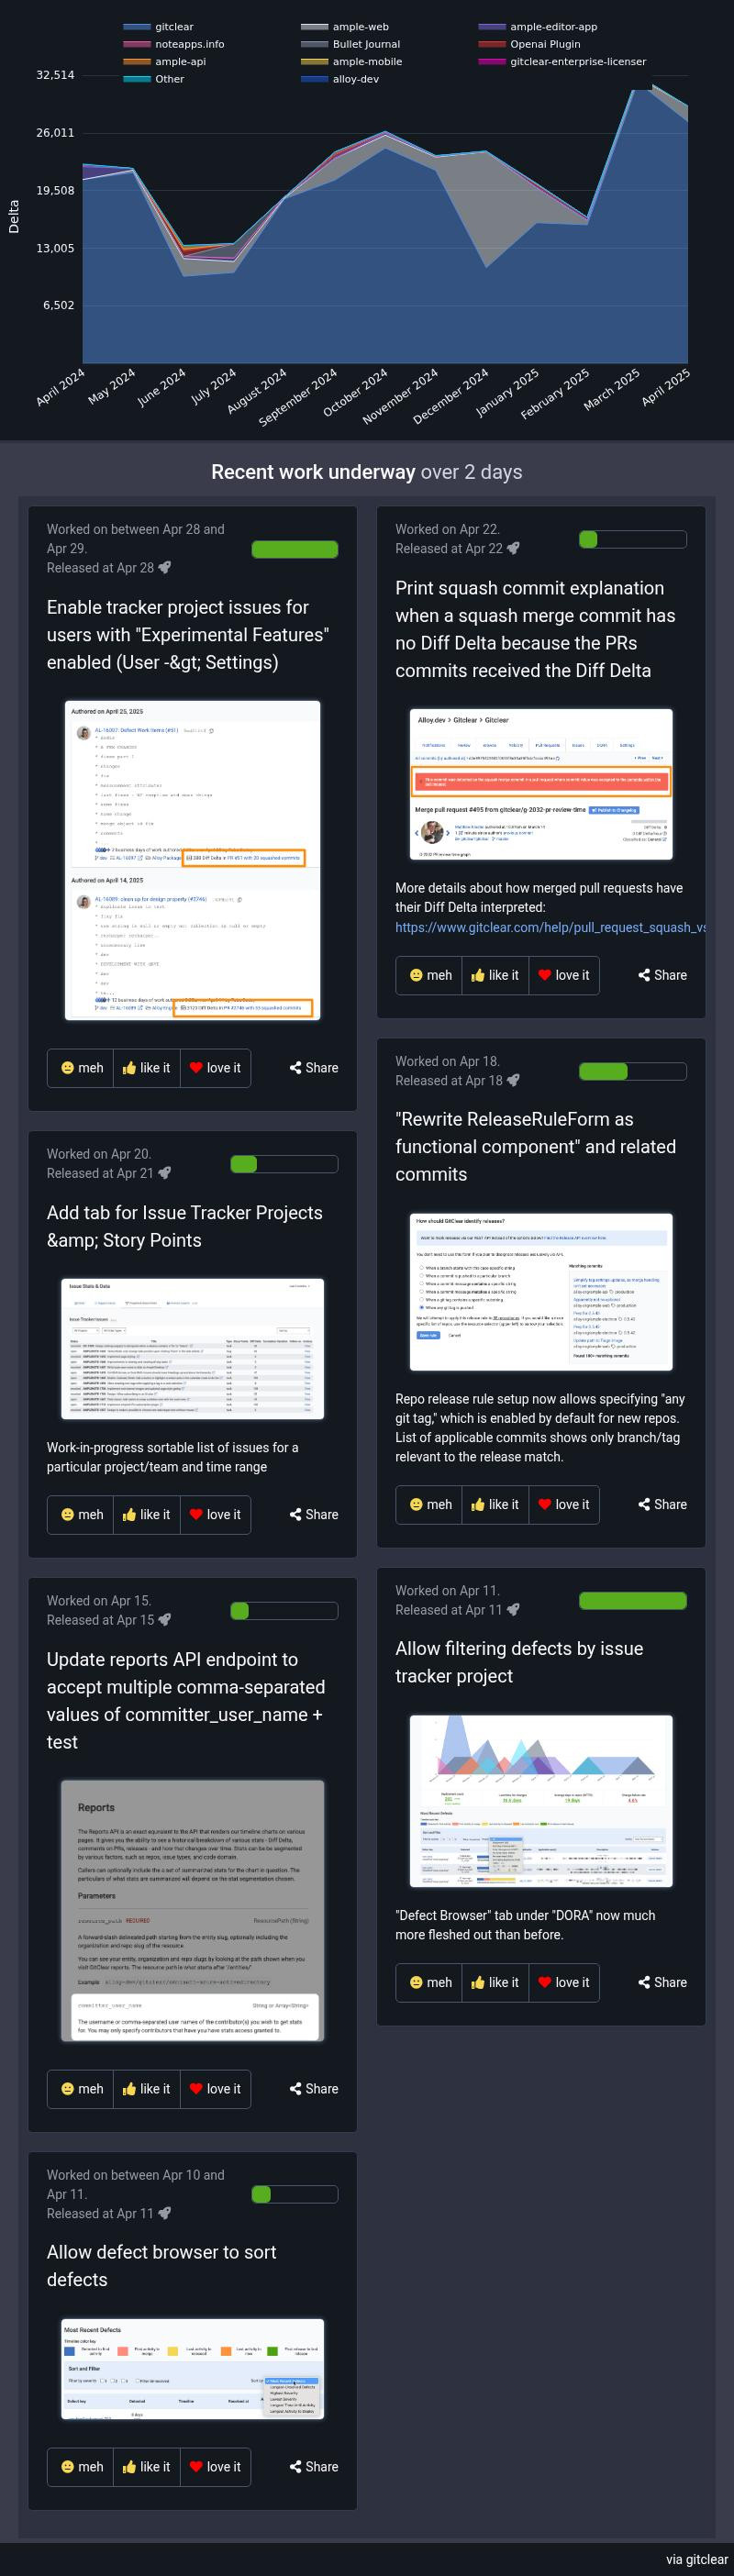
The quantity being graphed in these charts is Diff Delta -- see docs or two-minute explainer video. tl; dr it analyzes loc and tosses out the ~95% that is noise to get a number that approximates the rate of meaningful change in a repo.
Want to see what your AI-generated changelog looks like? Sign up via this page and we'll expedite your changelog setup.
GitClear updates these charts with fresh data every hour. Empirically, GitHub seems to cache them for about half a day at a time.
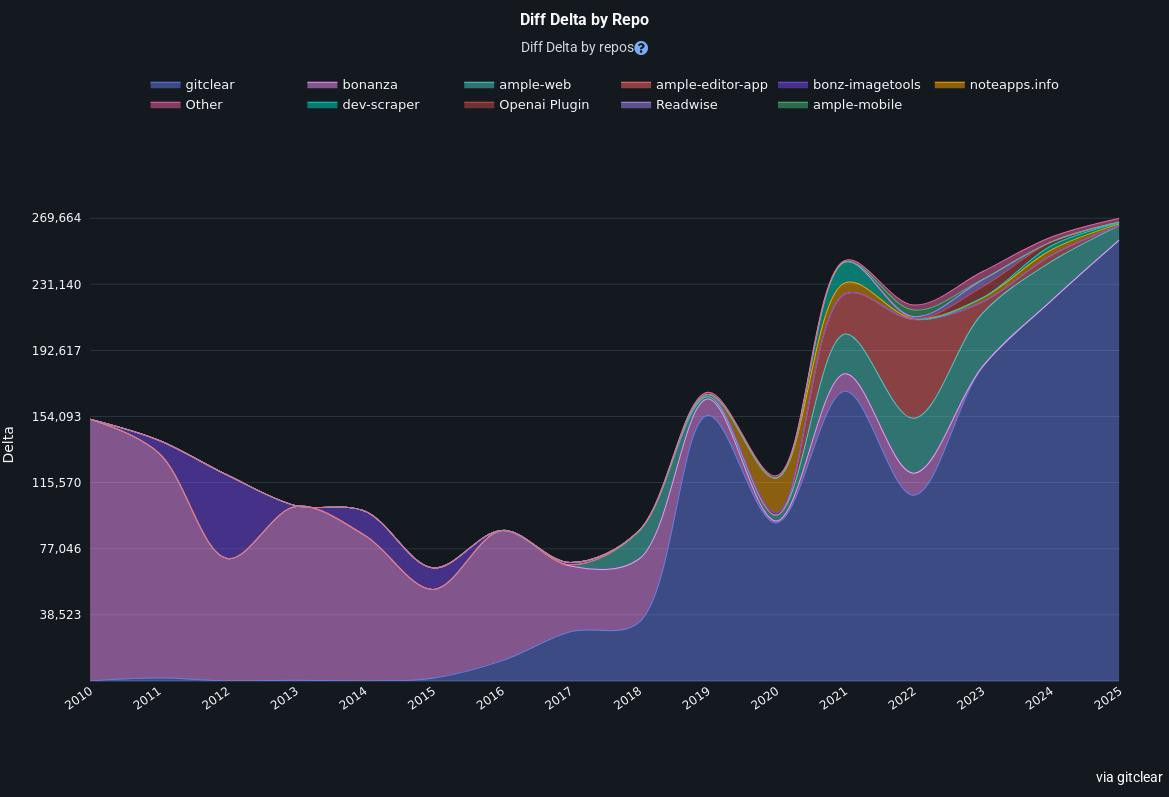
- Note that the final year is a projected estimate, derived by taking this year's Diff Delta velocity and multiplying it by the fraction of the year still to come.