Ready to use log management solution for Kubernetes. Efficiently store big amounts of your logs (in ClickHouse database), process them using a simple query language and monitor them online through web UI. Easy and quick to deploy in an already functioning Kubernetes cluster.
Status is alpha. However we (Flant) use it in our production Kubernetes deployments since September, 2017.
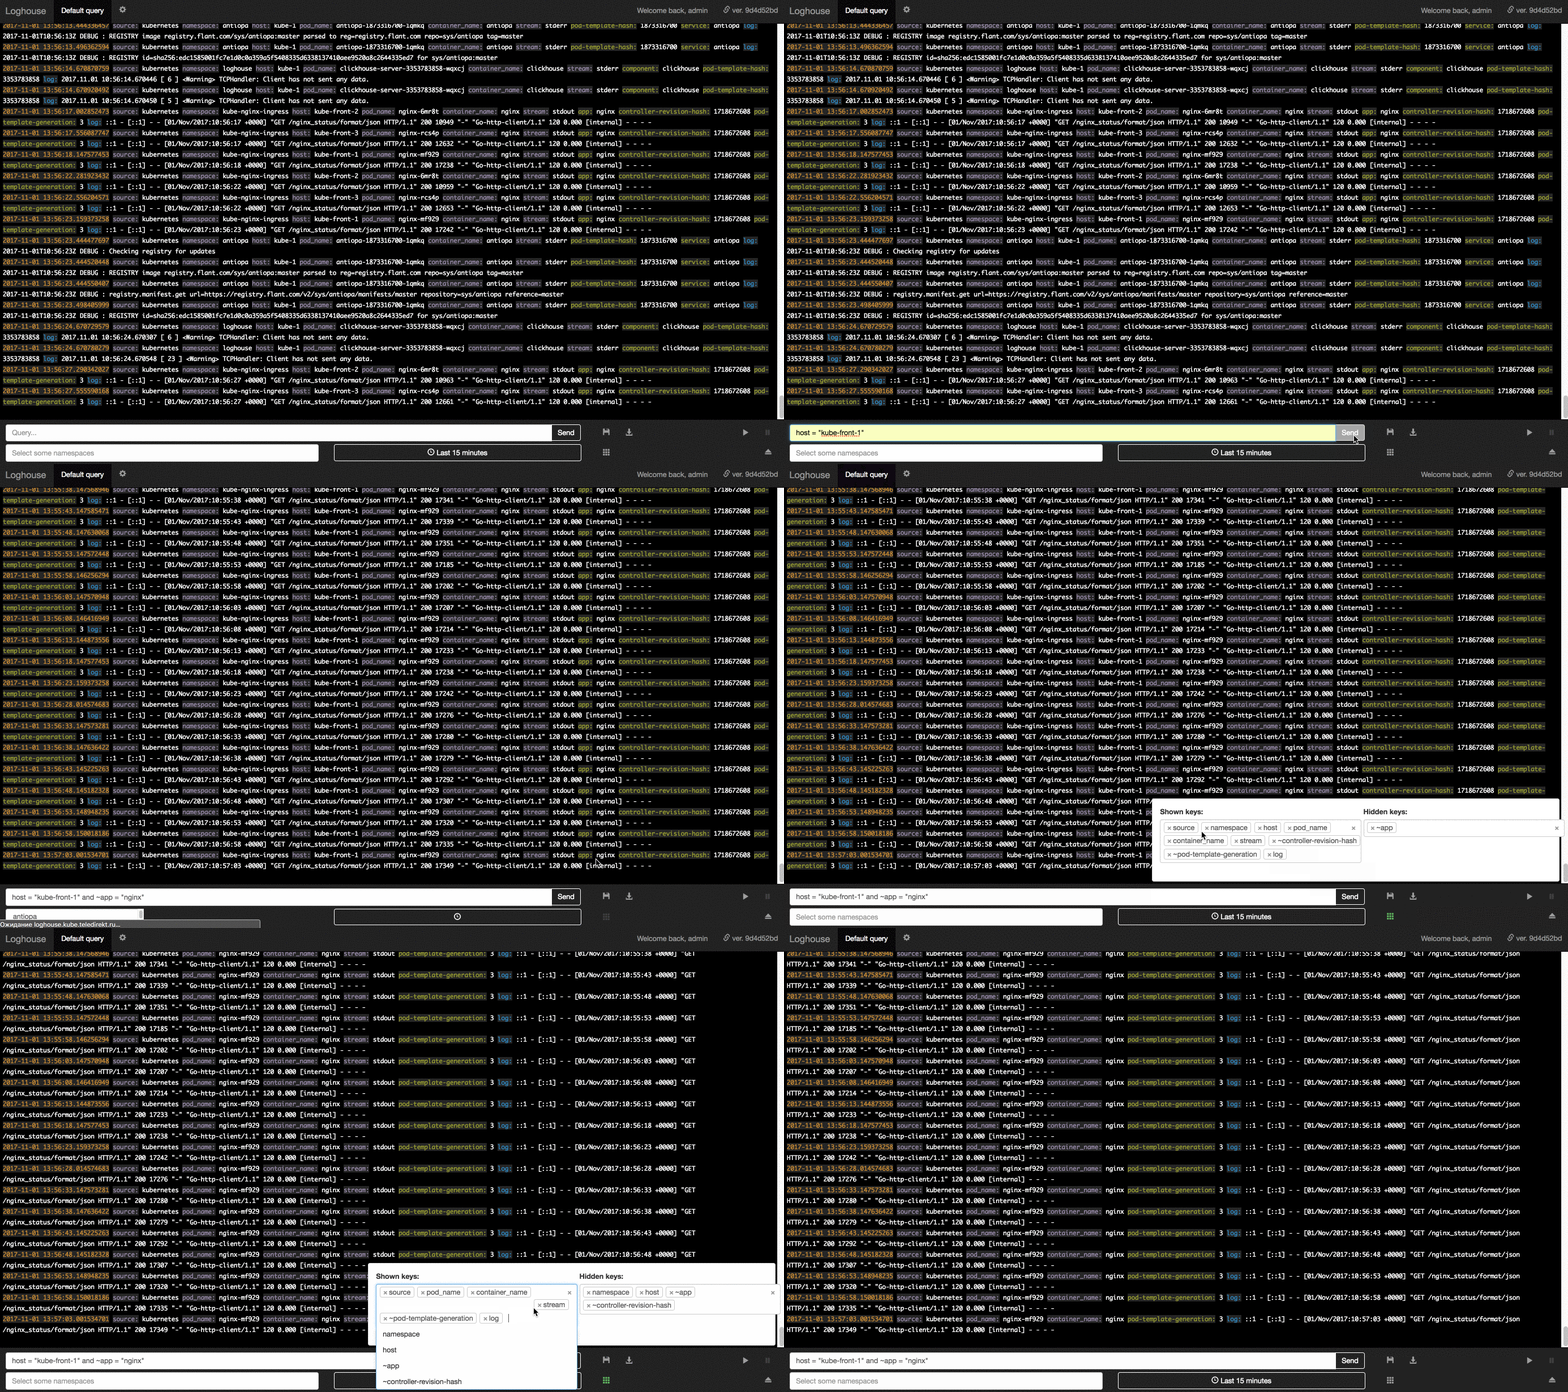
Loghouse-dashboard UI demo in action (~3 Mb):
- Collecting and storing logs from all Kubernetes pods efficiently:
- Fluentd processes upto 10,000 log entries per second consuming 300 MB of RAM (installed at each K8s node).
- ClickHouse makes disk space usage minimal. Examples of logs stored in our production deployments: 3.7 million entries require 1.2 GB, 300m — 13 GB, 5,35 billion — 54 GB.
- Simple query language. Easy to select entries by exact keys values or regular expressions, multiple conditions are supported with AND/OR. Learn more in docs.
- Selecting entries based on additional containers' data available in Kubernetes API (pod's and container's names, host, namespace, labels, etc).
- Quickly & straightforward deployable to Kubernetes via Dockerfiles and Helm chart.
- Web UI made cosy and powerful:
- Papertrail-like user experience.
- Customizable time frames: from date to date / from now till given period (last hour, last day, etc).
- Infinite scrolling of older log entries.
- Save your queries to use in future.
- Basic permissions (limiting entries shown for users by specifying Kubernetes namespaces).
- Exporting current query's results to CSV (more formats will be supported).
To install loghouse, you need to have Helm in your Kubernetes cluster. The whole process is as simple as these two steps:
- Add loghouse charts:
# helm repo add loghouse https://flant.github.io/loghouse/charts/
- Install a chart.
2.1. Easy way:
# helm fetch loghouse/loghouse --untar
# vim loghouse/values.yaml
# helm install -n loghouse loghouse
2.2. Using specific parameters (check variables in chart's values.yaml — not documented yet):
# helm install -n loghouse loghouse/loghouse --set 'param=value' ...
Web UI (loghouse-dashboard) will be reachable via address specified in values.yaml config as loghouse_host. You'll be prompted by basic authorization generated via htpasswd and configured in auth parameter of your values.yaml.
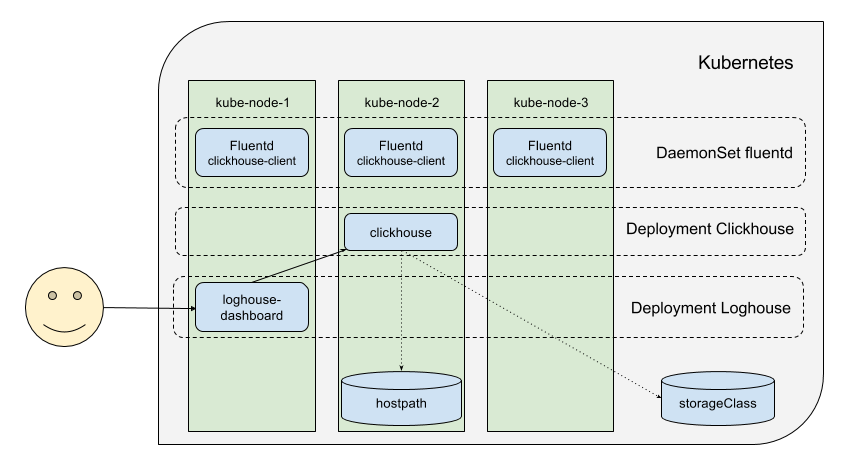
A pod with fluentd collecting logs will be installed on each node of your Kubernetes cluster. Technically, it is implemented by means of DaemonSet having tolerations for all possible taints, so it includes all the nodes available. Logs directories from all hosts are mounted to fluentd pods and watched by fluentd. Kubernetes_metadata filter is applied for all the Docker containers' logs to get additional information about containers via Kubernetes API. Another filter, record_modifier, is then used to "prepare" all the data we have. And the last step is passing this data to fluentd output plugin executing clickhouse-client CLI tool to insert new entries into ClickHouse DBMS.
Note on logs format: If log entry is in JSON, it will be formatted according to its values' types, i.e. each field will be stored in corresponding table: string_fields, number_fields, boolean_fields, null_fields or labels (the last one is used for containers labels to make further filtering and lookups easy). ClickHouse built-in functions will be used to process these data types. If log entry isn't in JSON, it will be stored in string_fields table.
Currently, ClickHouse DBMS is deployed as a single instance via Deployment which brings this instance to a random K8s node (this behaviour can be changed by using nodeSelector and tolerations to choose a specific node). ClickHouse stores its data in hostPath volume or Persistent Volumes Claim (PVC) created with any storageClass you prefer.
Web UI is composed of two components:
- frontend — nginx with basic authorization. This authorization is used to limit user's access with logs from given Kubernetes namespaces only;
- backend — Ruby application displaying logs from ClickHouse.
We're going to add another deployment options (having ClickHouse instances on each K8s node or having a ClickHouse cluster), migrate frontend to AngularJS and backend to Golang, add command-line interface (CLI) and much more.
More details will be available soon in our issues.

