-
Notifications
You must be signed in to change notification settings - Fork 73
Tutorial EEG to ERPset 1: Getting started and loading EEG data
We assume that Matlab is installed, that EEGLAB is installed and in the Matlab path, and that ERPLAB is correctly installed in the EEGLAB plugin subfolder. If not, see the installation instructions here.
Download the example EEG data files here. Unzip to a known folder, here we show C:\m\eegdata\erplab_tut. Note that there is a subfolder for each experiment subject, S1 to S6.

Within the S1 subfolder, you the S1_EEG.set file. This file contains the continuous EEG data for subject 1 in EEGLAB format, and also includes some meta data, like the event code timing information.
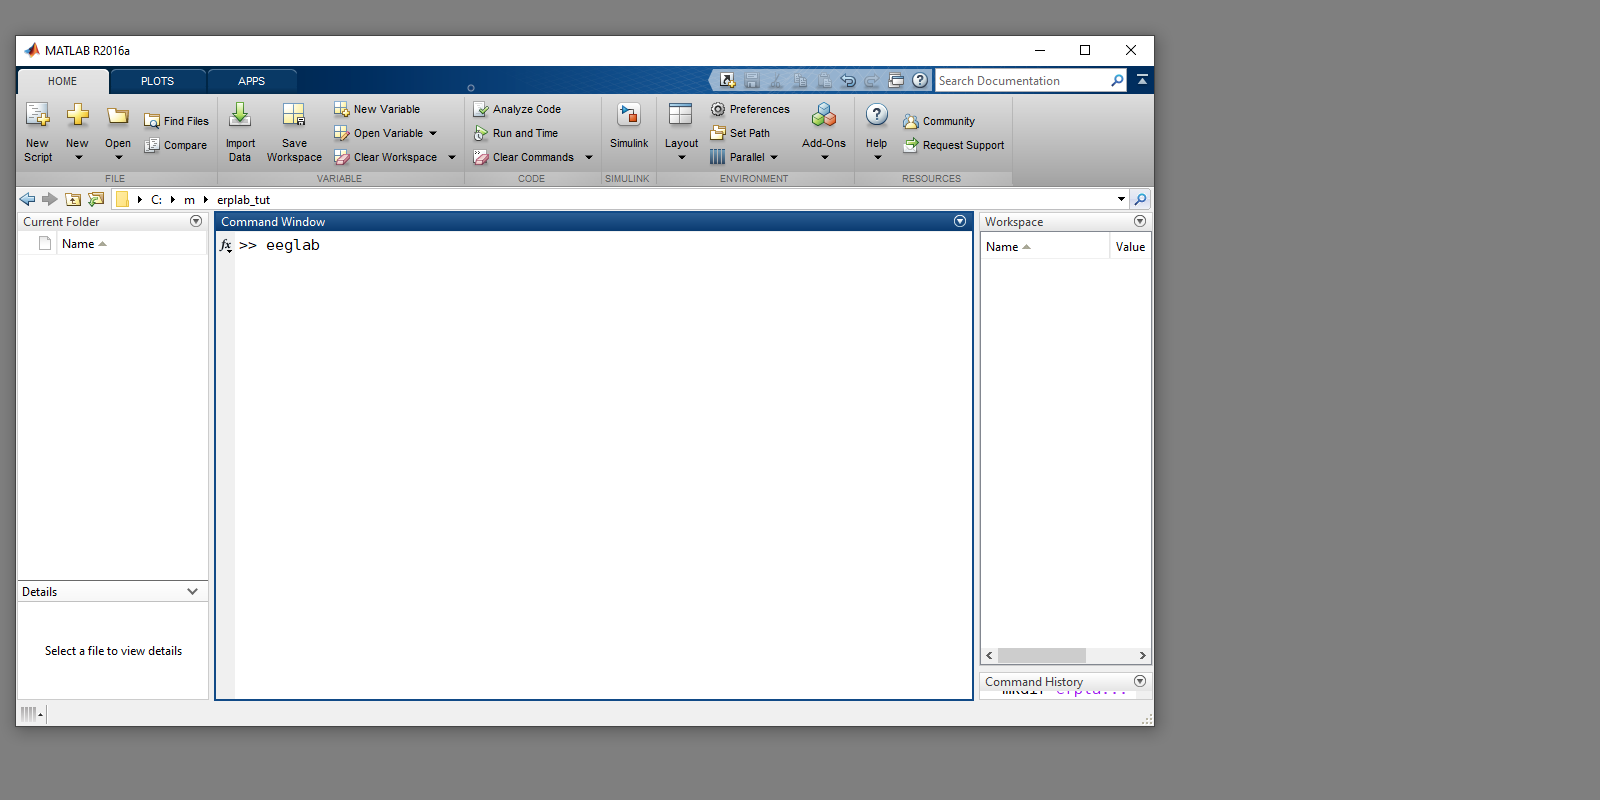
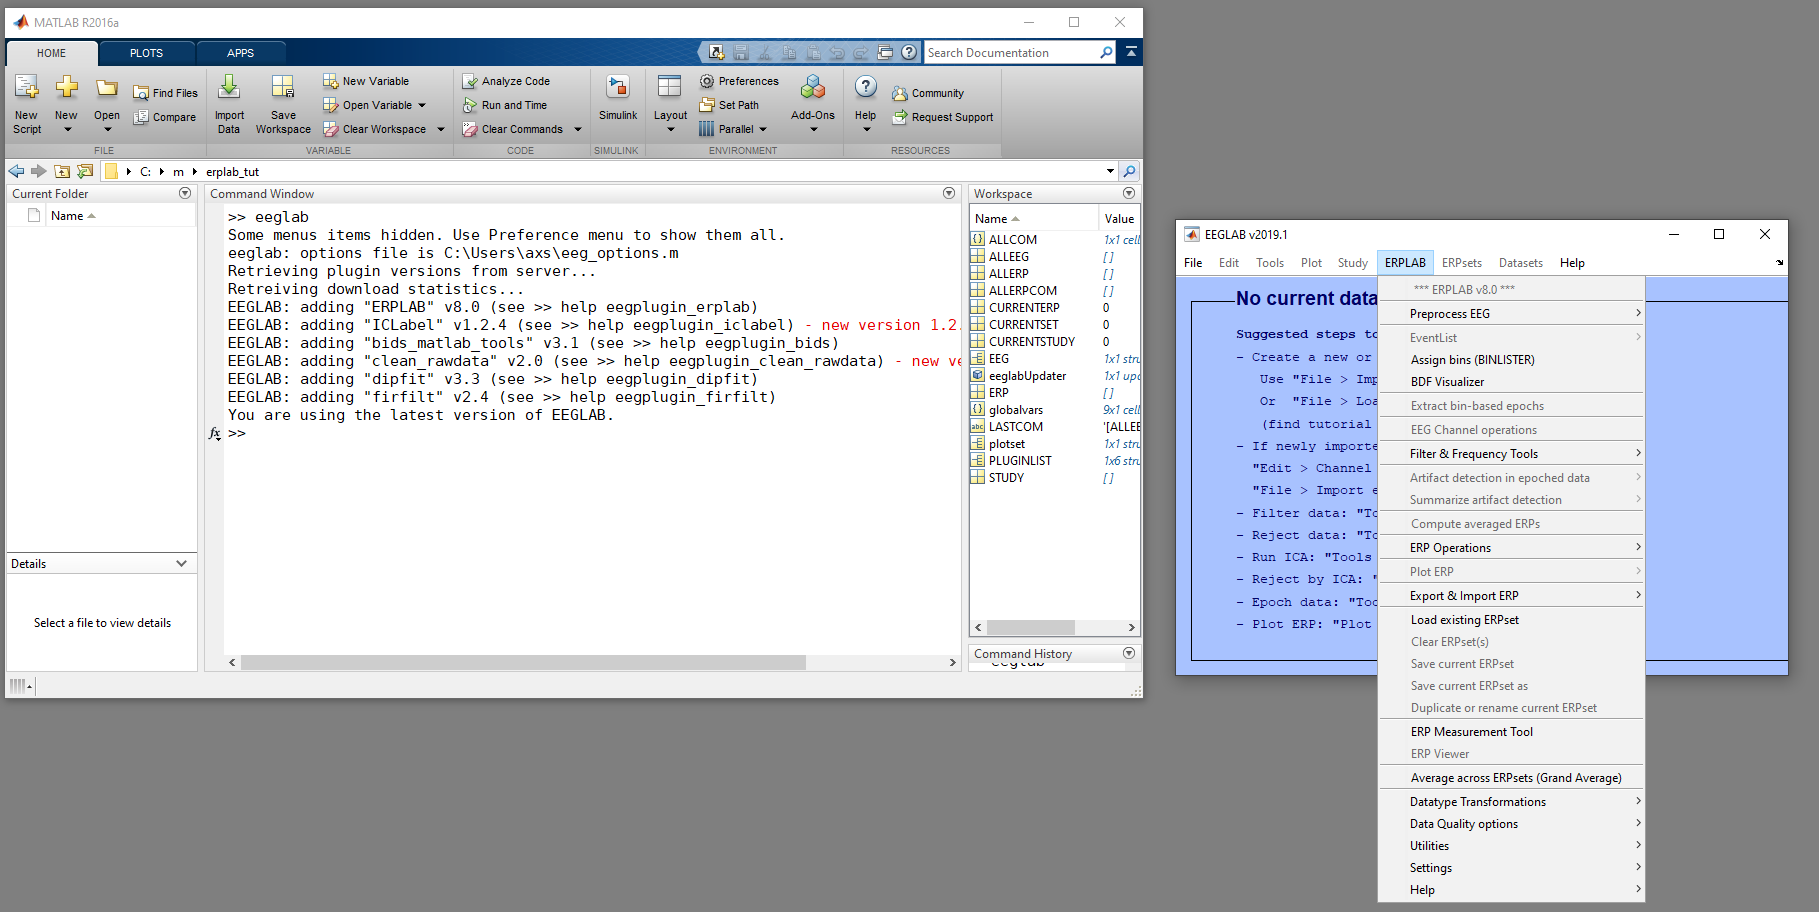
You should see something close to these screenshots. :
Matlab environment, entering eeglab in the Command Window

A new window appears for EEGLAB, with the ERPLAB menu:

If you encounter an error here, check that ERPLAB is installed correctly, and the troubleshooting hints.
With EEGLAB started within Matlab, hit File > Load existing dataset.

Select the S1_EEG.set file, from the S1 subfolder in the path you unzipped example EEG data to.
The EEGLAB window should now update to show some information about this loaded EEG set:

Also, a list of currently loaded EEG sets is shown in the EEGLAB window as a dropdown menu, now containing Dataset 1: S1_EEG. There is also dropdown menu for ERPsets, and this remains empty, as we have only loaded continuous EEG data.
There are several aspects to the EEG datasets that are good to keep in mind. As these can be observed and verified here, it is good practice to do so at this stage:
- What data do I have? How many EEG channels? What is the duration of the recording?
This can be found within the blue EEGLAB GUI (as shown in screenshots above), where the channels per frame tells you the number of channels. The number of epochs is 1, the epoch start time is 0, and the epoch end time is 2139 s, indicating that the loaded and currently selected EEG set is continuous data, and runs from t=0 s to t=2139 s, giving (2139/60) around a 35 minute recording. This is EEG data recorded at a sample rate of 500 Hz, so there are (2139 * 500) around 1,069,500 datapoints for each electrode.
This information can also be accessed programatically within Matlab, with commands like:
EEG.nbchan size(EEG.data) EEG.srate
- What events occur within this recording? Are there event codes (aka event markers, triggers) indicating the relevant times of stimuli presentation and response?
From the EEGLAB window, we can plot the EEG recording data, through Plot menu -> Channel data (scroll).

Channel data is presented with one channel atop another, with channel F3 on top here. If you advance the time from 0 s to 10 s, you can observe two large deflections of more that 50 µV that occur at around 10.5 s and 12 s. These are likely blinks.

Additionally, there are straight vertical dashed lines, of different colors. There are none of these in the first 12 seconds of this recording, and 4 in the trace shown above, at around 13.1, 13.6, 14.3, and 14.8 seconds. These are the event codes, indicating an event of type 22, 9, 12, 9 occurred at the respective times.
These event codes have been generated by the experimental stimuli script at the time of recording the EEG, and included with the EEG data. The 22 indicates the presentation of a certain type of frequently shown stimulus, the 12 indicates a certain type of rarely shown stimulus, and 9 indicates the time at which the subject made a buttonpress response. Here, we wish to observe that this data exists, and agrees with our expectations of this experiment.
This information can also be accessed programatically within Matlab, with commands like:
pop_squeezevents(EEG)

- What ERPs are desired? What timeframe is desired to show these ERPs?
Your research question will determine what the ERP and timeframes that are central for your experiment. Hopefully, your experimental design captures this ERP component well. There exists guides to help, like the Oxford Handbook of ERPs for example.
Now that we have loaded and examined some data, the next step is to attach an EventList:
| Requirements | Completed? |
|---|---|
| Load EEG Data | ✓ |
| Creating an EventList | |
| Creating Bin-Based EEG Epochs | |
| Artifact Detection | |
| Creating Averaged ERPs |
|
Tutorial Overview |
Tutorial list |
EventLists |