-
Notifications
You must be signed in to change notification settings - Fork 8
System logs
Starting with TAP 0.7, a log aggregation solution is available using an ElasticSearch, Logsearch, Kibana (ELK) stack. Once TAP is installed and configured, CloudFoundry and applications automatically write logs to a remote endpoint, where they are parsed and stored in JSON format. You can query across your aggregated CF and application logs using the Kibana GUI, available through a new endpoint named http://logs.<CF-DOMAIN>
Currently, only CloudFoundry infrastructure and application logs are supported by this logsearch capability.
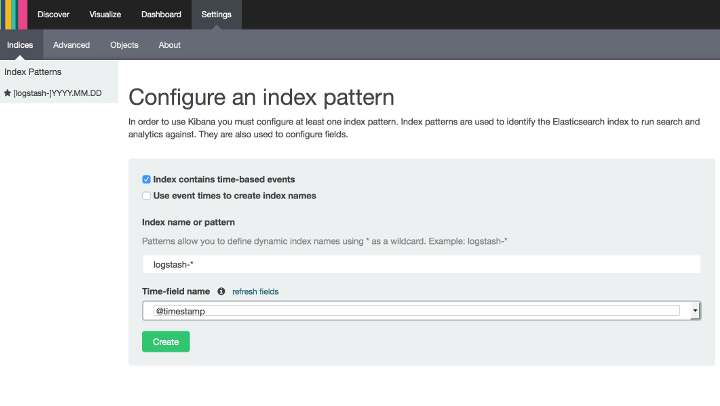
There is one step you must do manually before using Kibana - configuring an index pattern.
Follow the Kibana wizard, and set Index name or pattern to logstash-* and Time-field name to @timestamp. (You can also click on the Kibana Settings tab to do this.)
Documentation about Kibana, its query language, and features can be found here: https://www.elastic.co/products/kibana
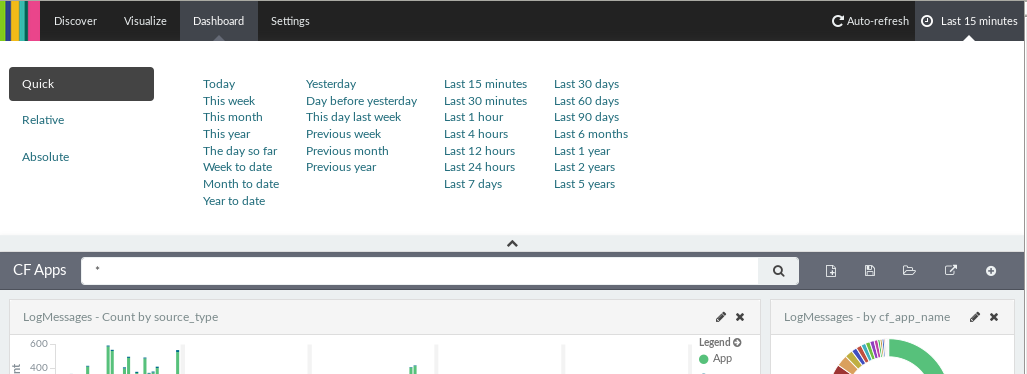
Kibana has an intuitive interface with 4 main tabs, a search box, and a timeline switch. On each tab, you can save your current settings/filters/layout under a custom name, as well as load your previously saved configurations.
From the timeline box, you can set the time range and refresh interval for the current view.
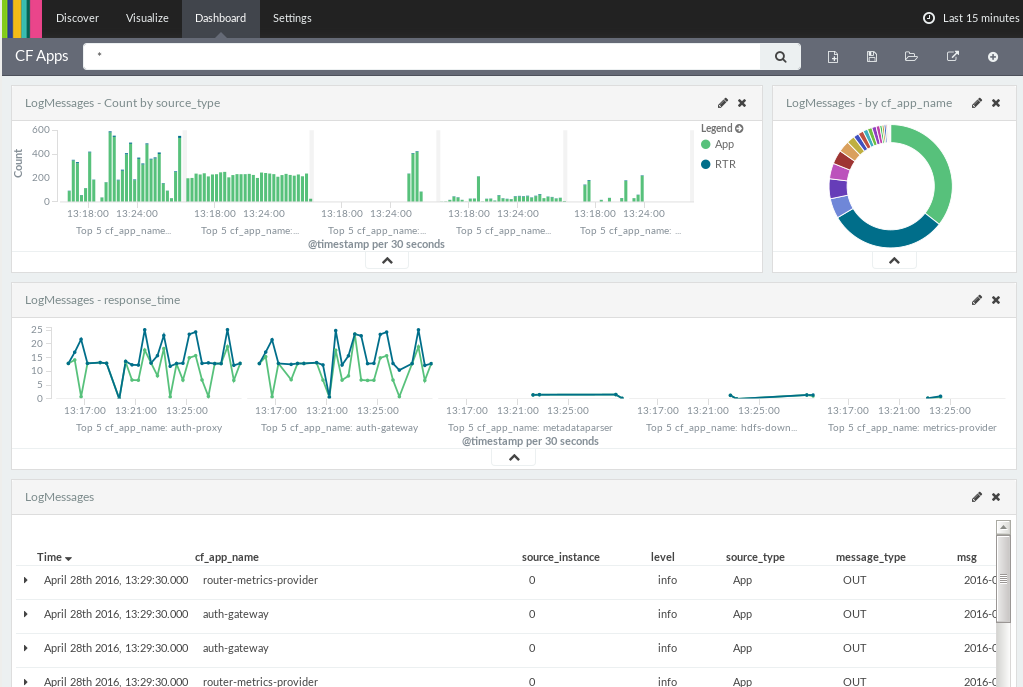
TAP provides some predefined searches/visualisations/dashboards to make it easy to get started. For example, the 'CF Apps' dashboard provides some activity charts and direct log entries aggregated from all running apps.
On the Discover tab, you can easily select and filter all logs to match your search goals.
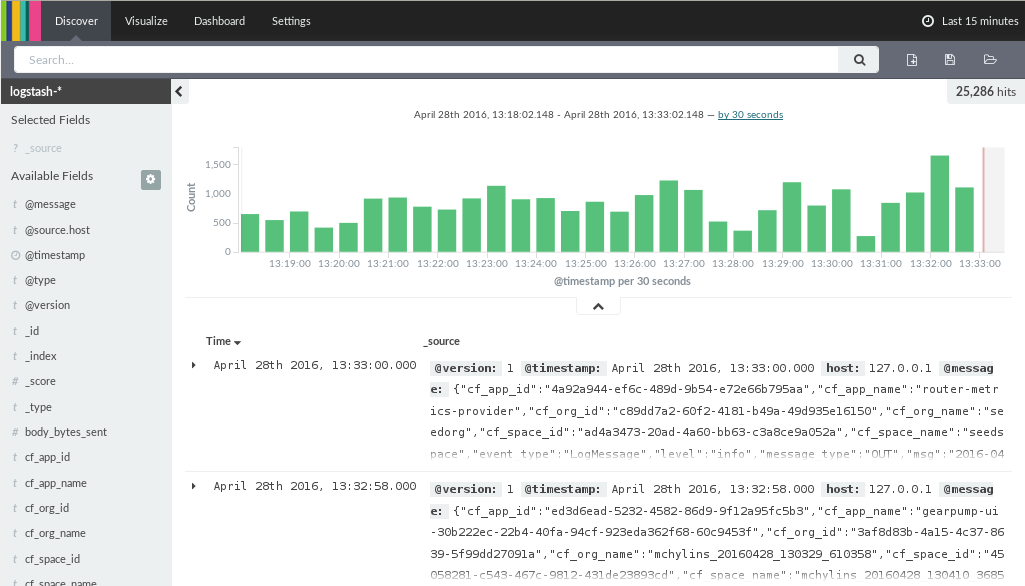
Simply select a field of interest on the left column, then choose a value to add to filters. You can combine many different fields to narrow the results.
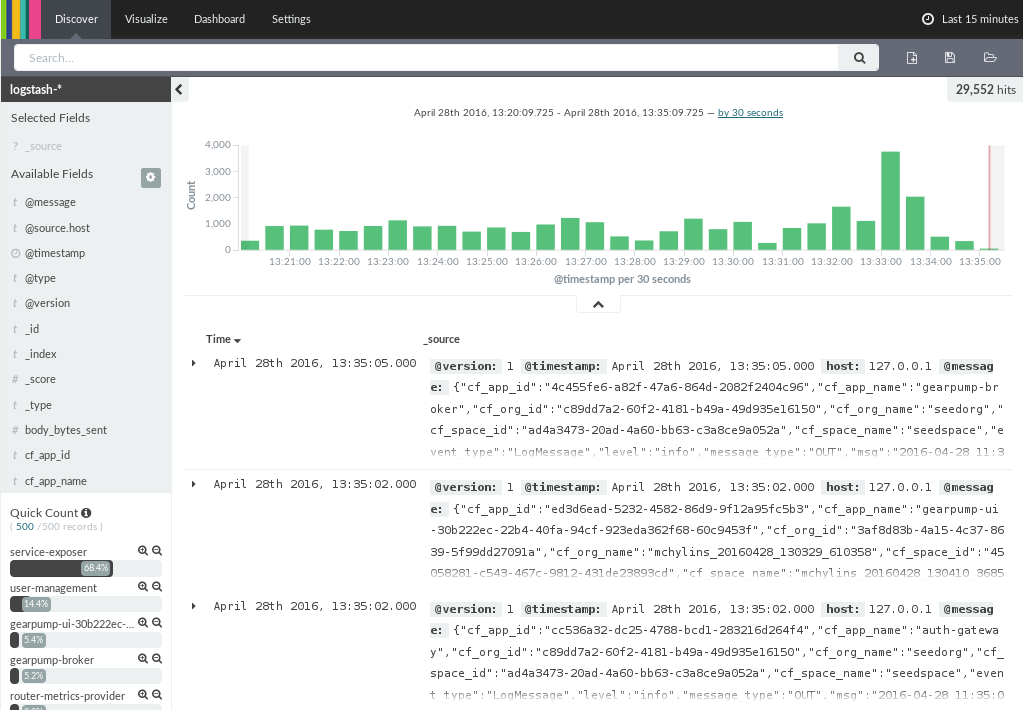
To show how Kibana may be used in practice, let’s tackle a real-world problem you may stumble upon in TAP. Sometimes you may be too late trying to roll up log data when using the Cloud Foundry Command Line Interface (CF CLI) log command. Some logs may not be available any longer, e.g., because a crashed instance has been already removed. This is because the --recent flag shows just a snippet of most recent events. (When an application does not exist anymore, the ‘cf logs’ command is not available for that application.) Fortunately, all records can be easily viewed via a Kibana search.
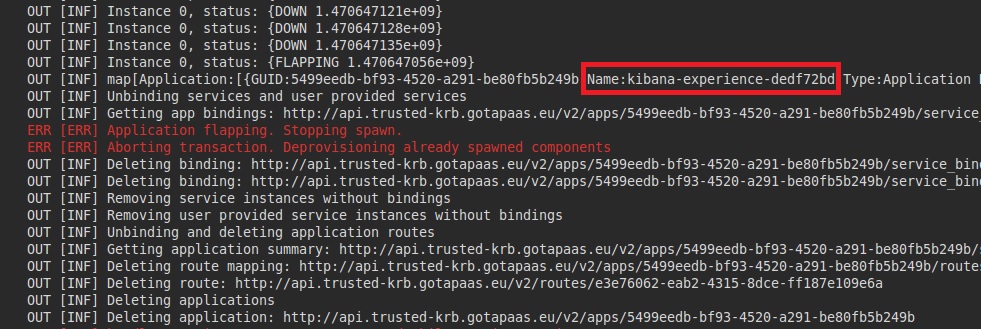
As an example, let's consider starting a service instance managed by application-broker. Occasionally, a new service instance (with application underneath) may crash. In this situation, Cloud Foundry deletes the failed instance automatically. To get information on the cause of the failure, we will use Kibana.
- Find out the name of the application that failed (in application-broker logs). You can use either CF command line interface or Kibana search tool.
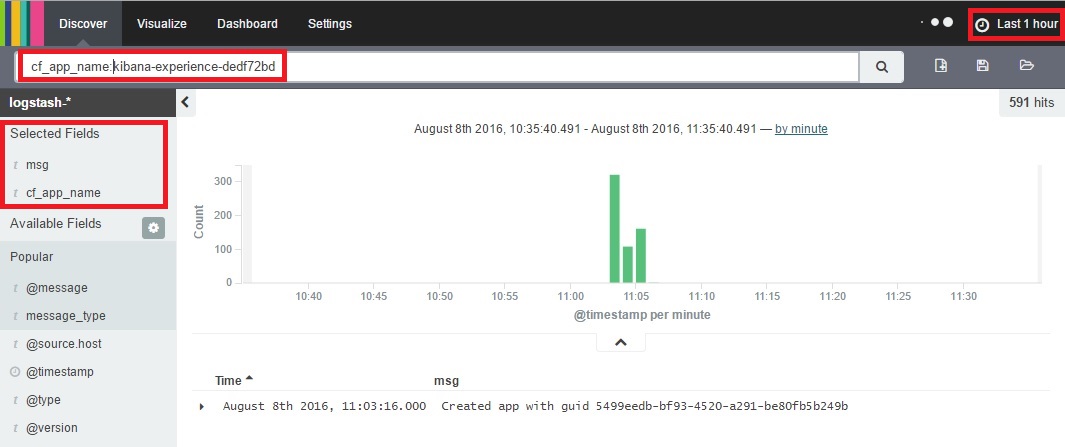
- Set the time to look at a recent window (e.g., the last hour).
- Filter using the name of the crashed application.
- Choose the fields to display.
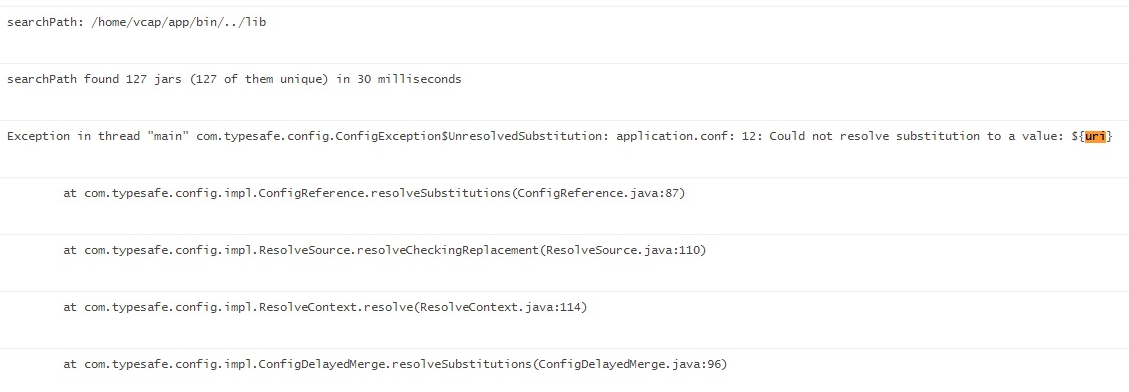
- Scroll through the results page to locate the exception.
All logs from Cloudera Cluster can be viewed through the Cloudera Manager WebGUI. There are many separate logs for each service, role, etc.
All applications running on a YARN/SPARK cluster write their logs to HDFS. Here are the steps to examine these logs:
-
Check YARN logs through an ssh tunnel:
ssh -i keyToEnv ubuntu@JUMPhostIP -D {Port}(keyToEnv - you need to have an ssh key to login to the jump node. Use the same {Port} number you enter here in Step 4 below.)
-
Go to your browser network settings (in this example:Mozilla Firefox) - options -> advanced -> network -> settings.
-
In the settings tab, select Manual proxy configuration.
-
Fill SOCKS Host with ‘localhost’, port ‘{Port}’, and check the checkboxes for remote DNS and to use SOCKS v5.
-
In your web browser, navigate to the url: ‘http://cdh-master-2.node.envname.consul:7180/’. Note: ‘envname’ is the default TAP environment name. However, systems admins can change it at deployment time. So you should check it using your jump host, as follows:
1/ on JUMPhost:
$ sudo -i
$ ssh ec2-user@cdh-master-2
2/ on cdh-master-2
$ hostname
This sequence will return the URL to use in your web browser.
-
Log in to Cloudera Manager with your admin credentials.
-
Click on YARN.
-
On the top tab, select Web UI, then ResourceManager Web UI. You will be on the YARN webUI.
-
Click on the running application, then select your application.
-
In a new window, open logs tab.
Now you can check your log file.
Note: Log files can also be checked on cdh-masters or cdh-workers, as follows:
-
If you are using the CDH WebUI, click a component you are interested in. This will show you that the service is working (e.g., datanode - cdh-worker-0).
-
Or you can use the following commands:
$ go to JUMPhost machine
$ sudo -i
$ ssh ec2-user@cdh-worker-0
$ sudo -i
$ cd /var/log/hadoop-hdfs
This sequence will show you status for all the data nodes.