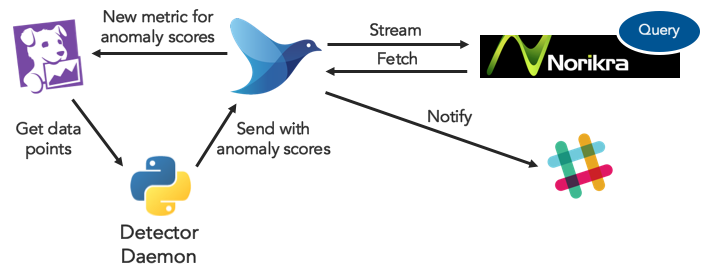
Get Datadog metrics and pass anomaly scores to Datadog itself via Fluentd.
By integrating CEP engines such as Esper and Norikra, you can implement more practical applications as the following picture illustrates. We introduce it in doc/norikra.md.
- Python 3.x (2.x is not supported)
- Fluentd 0.12.x
See requirements.txt
Note: You can replace td-agent with fluent depending on your system environment.
Follow Installation | Fluentd and configure /etc/td-agent/td-agent.conf as:
<match changefinder.**>
  @type copy
  deep_copy true

  <store>
    @type record_reformer
    renew_record true
    renew_time_key time

    tag datadog.${tag}
    <record>
      metric ${metric_outlier}
      value ${score_outlier}
      time ${record["time"]}
    </record>
  </store>

  <store>
    @type record_reformer
    renew_record true
    renew_time_key time

    tag datadog.${tag}
    <record>
      metric ${metric_change}
      value ${score_change}
      time ${record["time"]}
    </record>
  </store>
</match>

<match datadog.changefinder.**>
  @type dd
  dd_api_key YOUR_API_KEY
</match>
Since the configuration depends on fluent-plugin-dd and fluent-plugin-record-reformer, you need to install the plugins via td-agent-gem.
Finally, restart td-agent: $ sudo service restart td-agent.
Clone this repository:
$ git clone [email protected]:takuti/datadog-anomaly-detector.git
$ cd datadog-anomaly-detector
Create config/datadog.ini as demonstrated in config/example.ini.
$ cat config/datadog.ini
[general]
pidfile_path: /var/run/changefinder.pid

; Datadog API access interval (in sec. range)
interval: 600

[datadog.cpu]
query: system.load.norm.5{chef_environment:production,chef_role:worker6-staticip} by {host}

; ChangeFinder hyperparameters
r: 0.02
k: 7
T1: 10
T2: 5

[datadog.queue]
query: avg:queue.system.running{*}

r: 0.02
k: 7
T1: 10
T2: 5
You can insert a new config for a different query (metric) by creating a new [datadog.xxx.yyy] section as:
[datadog.add1]
query: additional.metric.1{foo}

r: 0.02
k: 7
T1: 10
T2: 5

...
Here, the above Fluentd configuration enables to create a new Datadog metrics changefinder.outlier.xxx.yyy and changefinder.change.xxx.yyy* for a configured section [datadog.xxx.yyy]. Since the names are very important to monitor the anomaly scores, you have to decide it carefully.
Note that r, k, T1 and T2 are the parameters of our machine learning algorithm. You can set different parameters for each query if you want. In case that you do not write the parameters on the INI file, default parameters will be set. In particular, optimal k is chosen by a model selection logic as described in doc/changefinder.md#model-selection.
In order to get Datadog metrics, we need to first set API and APP keys as environmental variables DD_APP_KEY and DD_API_KEY.
Now, we are ready to start a detector daemon as:
$ python daemonizer.py start
For the .pid file specified in config/datadog.ini, please make sure if the directories exist correctly and you have write permission for the path.
You can stop the daemon as follows.
$ python daemonizer.py stop
MIT
