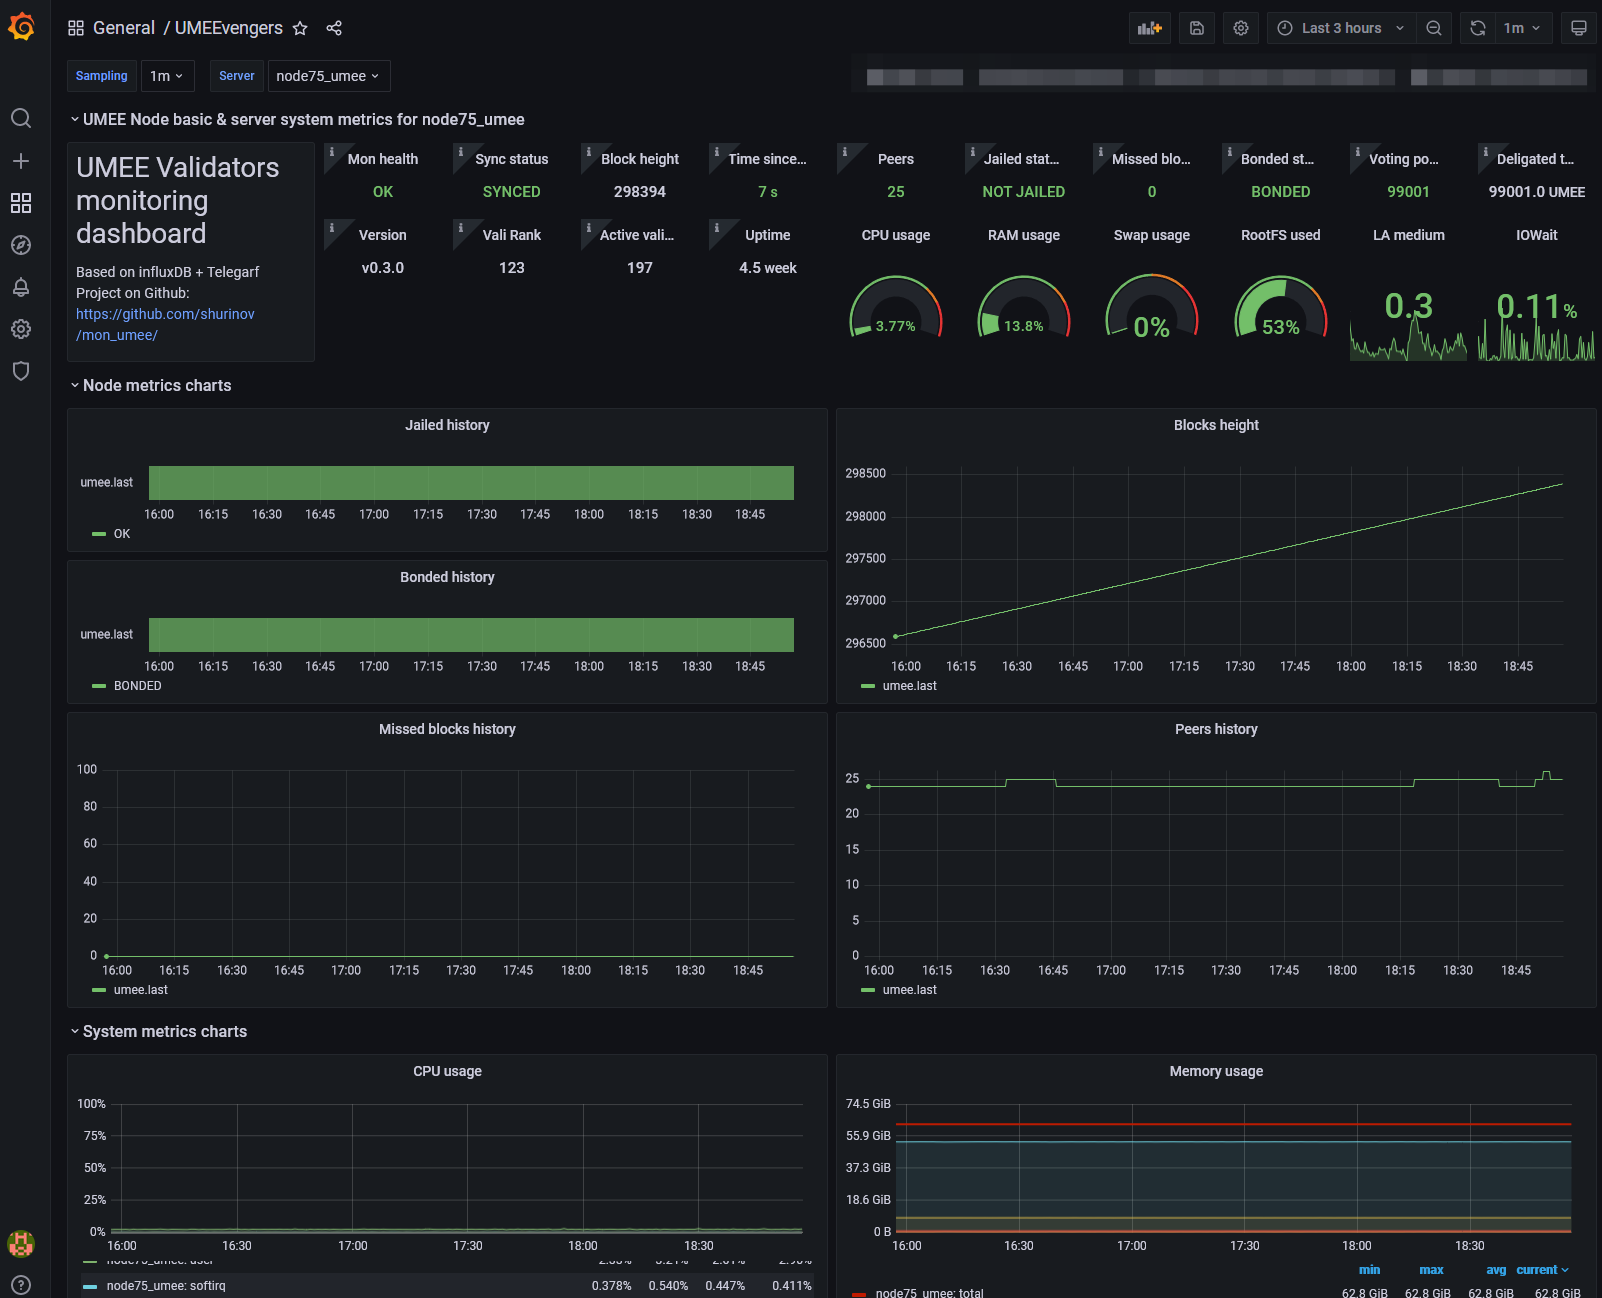
This project based on shurinov/mon_umee - easy to install monitoring tool. But that solution dosen't have an open monitoring service.
UMEE Community Monitoring soleved this. You no longer need to think about where to host the monitoring server.
To monitor you node your should have installed and configured:
- UMEE node which should be configured (correct moniker, validator key, network ports setup)
- Telegraf agent
- mon_umee scripts set
The easiest way is to use the quick installation script.
You can use quick installation script IMPORTANT: You sholud to run the script under the user where it is installed umee node.
Don't use sudo if UMEE-user is not a root
wget https://raw.githubusercontent.com/svv28/mon_umee/main/mon_install.sh
chmod +x mon_install.sh
./mon_install.sh
It will install telegraf agent, clone project repo and extract your node data as MONIKER, VALOPER ADDR, RPC PORT.
Install telegraf
sudo apt update
sudo apt -y install curl jq bc

# install telegraf
sudo cat <<EOF | sudo tee /etc/apt/sources.list.d/influxdata.list
deb https://repos.influxdata.com/ubuntu bionic stable
EOF
sudo curl -sL https://repos.influxdata.com/influxdb.key | sudo apt-key add -

sudo apt update
sudo apt -y install telegraf

sudo systemctl enable --now telegraf
sudo systemctl is-enabled telegraf

# make the telegraf user sudo and adm to be able to execute scripts as umee user
sudo adduser telegraf sudo
sudo adduser telegraf adm
sudo -- bash -c 'echo "telegraf ALL=(ALL) NOPASSWD:ALL" >> /etc/sudoers'
You can check telegram service status:
sudo systemctl status telegraf
Clone this project repo and copy variable script template
git clone https://github.com/svv28/mon_umee.git
cd mon_umee
cp mon_var_template.sh mon_var.sh
nano mon_var.sh
Insert your parameters to mor_var.sh:
- full path to umeed binary to COS_BIN_NAME ( check
which umeed) - node PRC port to COS_PORT_RPC ( check in file
path_to_umee_node_config/config/config.toml) - node validator address to COS_VALOPER ( like
umeevaloper********)
Save changes in mon_var.sh and enable execution permissions:
chmod +x monitor.sh mon_var.sh
Edit telegraf configuration
sudo mv /etc/telegraf/telegraf.conf /etc/telegraf/telegraf.conf.orig
sudo nano /etc/telegraf/telegraf.conf
Copy it to config and paste your server name (to do so it is convenient to use the node moniker):
# Global Agent Configuration
[agent]
  hostname = "YOUR_MONIKER/SERVER_NAME" # set this to a name you want to identify your node in the grafana dashboard
  flush_interval = "15s"
  interval = "15s"
# Input Plugins
[[inputs.cpu]]
  percpu = true
  totalcpu = true
  collect_cpu_time = false
  report_active = false
[[inputs.disk]]
  ignore_fs = ["devtmpfs", "devfs"]
[[inputs.io]]
[[inputs.mem]]
[[inputs.net]]
[[inputs.system]]
[[inputs.swap]]
[[inputs.netstat]]
[[inputs.diskio]]
# Output Plugin InfluxDB
[[outputs.influxdb]]
  database = "umeemetricsdb"
  urls = [ "http://pro-nodes.com:8086" ] # example http://yourownmonitoringnode:8086
  username = "metrics" # your database username
  password = "password" # your database user's password
[[inputs.exec]]
  commands = ["sudo su -c UMEE_BIN_NAME -s /bin/bash UMEE_USER"] # change home and username to the useraccount your validator runs at
  interval = "15s"
  timeout = "5s"
  data_format = "influx"
  data_type = "integer""
Dashboard has main cosmos-based node information and common system metrics. There is a description in it.
Complex parameter can show problem concerning receiving metrics from node. Normal value is "OK"
Node catching_up parameter
Latest blockheight of node
Time interval in seconds between taking the metric and node latest block time. Value greater 15s may indicate some kind of synchronization problem.
Number of connected peers
Validator jailed status.
Number of missed blocks in 100 blocks running window. If the validator misses more than 50 blocks, it will end up in jail.
Validator stake bonded info
Validator voting power. If the value of this parameter is zero, your node isn't in the active pool of validators
Number of delegated tokens
Version of umeed binary
Your node stake rank
Total number of active validators
No comments needed)
