Theia trace viewer extension using the tsp-typescript-client (https://github.com/theia-ide/tsp-typescript-client) and Trace Server Protocol (https://github.com/theia-ide/trace-server-protocol).
Prerequisites for running this extension are the same as those for running the theia IDE.
👋 Want to help? Read our new contributor guide and see how to contribute code.
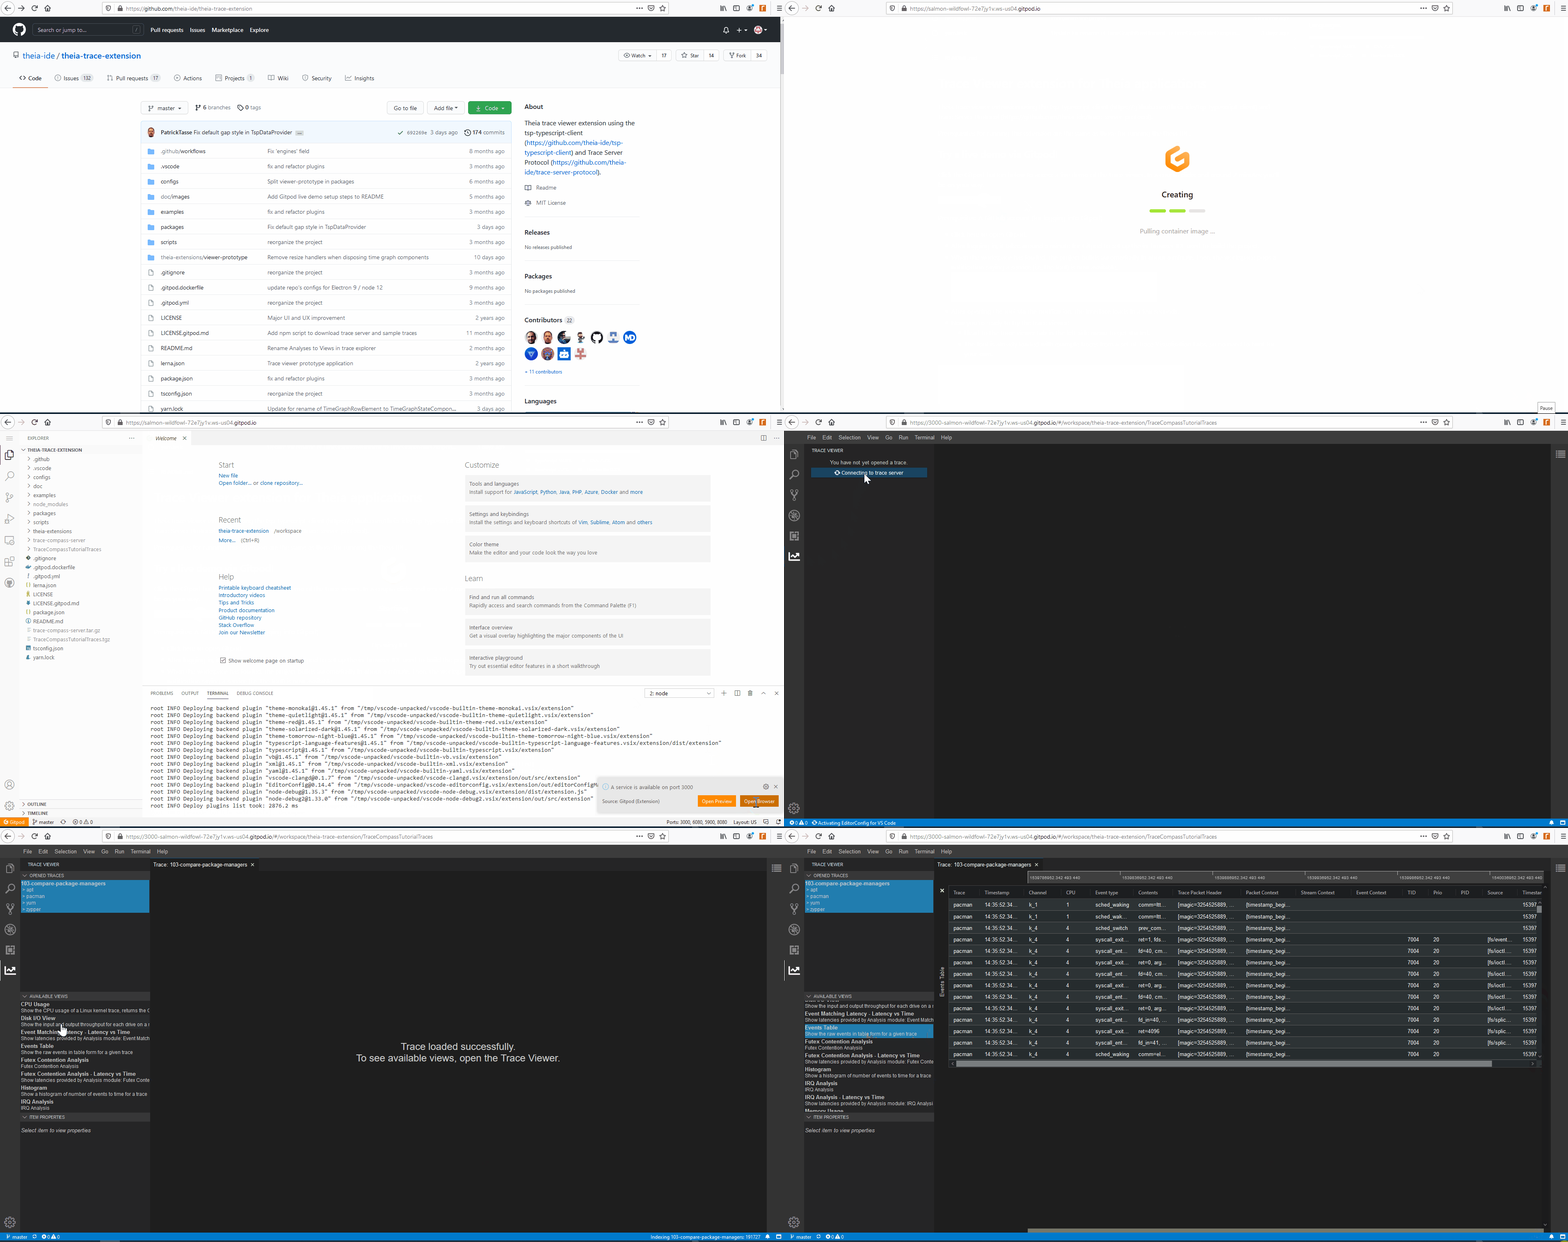
Click the Gitpod button below to access a live demo of the trace viewer. In a couple clicks and around 2 minutes you'll be on your way.
Prerequisites: A GitHub account (for logging into Gitpod)
- Click here to open Gitpod.
- After logging in, it takes around a minute for Gitpod to set up the in-browser IDE used to build the project.
- When the workspace has loaded, the project builds automatically in about a minute. Then, the workspace pops a notification saying a service (i.e. the tool) is now available.
- After opening the tool via the notification, the interface loads in a few seconds.
- Now you're ready to try the trace viewer!
- Head to the trace viewer tab in the left side menu to get started.
- The tool is loaded with the example traces from a set of Trace Visualisation Labs. To analyse your own traces, download the application for Linux.
If you'd like to explore your own traces, you can download a Theia IDE build with this trace viewer extension here!
- Prerequisite: Java 11 (required since this tool reuses the Eclipse Trace Compass server which runs on Java)
- If you get a confusing error "Error opening serial port ${this.port}. (Port busy)" when you try to run the app, it's likely that Java is missing.
- No compilation or additional downloads necessary! Just change the AppImage file's permissions to make it executable (command:
chmod +x <filename>) and run it. - For Linux systems only
The theia-trace-extension project publishes the following packages to NPM:
- theia-traceviewer: The Theia trace viewer extension. Add this package to the package.json of your Theia application.
- traceviewer-base: This package contains trace management utilities for managing traces using Trace Server applications that implement the TSP.
- traceviewer-react-components: This package contains views and utilities for visualizing traces and logs via the TSP connected to a Trace Server application.
While being initially used within the theia-traceviewer, the code base of traceviewer-base and traceviewer-react-components is independent to any Theia APIs and hence can be integrated in other web applications.
Here is the step in order to build the trace viewer
- Clone this theia-trace-extension repository
cd theia-trace-extension- Now you are ready to build the application:
yarn
Note for some debian-based machines: On some distros, there are 2 yarn commands. If you get an error message saying ERROR: There are no scenarios; must have at least one., you are using the wrong yarn. See yarnpkg/yarn#2821.
You can also run two scripts to watch for changes and rebuild automatically:
- From the root:
yarn tswatch # to compile TypeScript files- In parallel run:
cd examples/<browser or electron>
yarn watch # to update the frontend bundles (loaded by the browser)This repository contains an example trace-viewer application that includes the trace extension. It has two versions:
- browser: a "browser" application, accessed with a web browser
- electron: a native desktop application
You can find those example applications under examples/.
In order to open traces you need a trace server running on the same machine as the trace extension. You can download the Eclipse Trace Compass server or let yarn download and run it:
  $ yarn download:server
  $ yarn start:server
You can also build the trace-server yourself using Trace Compass and the Incubator, take a look at the instructions here.
From the repo root, run either
$ yarn start:browserAnd go to http://localhost:3000.
or
$ yarn start:electronAnd use the Electron application.
By default, the trace server is expected to be on responding at http://localhost:8080/tsp/api. If it is not the case, the URL can be changed using the TRACE_SERVER_URL environment variable when running the app.
For example, to start the browser example app with a specific URL, one can run
$ TRACE_SERVER_URL=https://my.trace.server:port/tsp/api yarn start:browserIt's possible to package the repo's example application with electron-builder. After running yarn in the repo root, do:
  $ cd examples/electron
  $ yarn package
The configured Linux packaging(s) will be generated in folder examples/electron/dist
To run tests once, at the root of the project do:
yarn test --verboseTo keep tests running do:
yarn test --verbose --watchThe following command prints a coverage report to the terminal. As of now it covers all typescript files of the project, including those that are not supposed to have tests.
yarn test --coverage --collectCoverageFrom='src/**/*.ts'This section describes how to operate the Theia trace extension to view and analyze traces. The UI, view interactions, and UX are prelimiary and subject to revisions in the future.
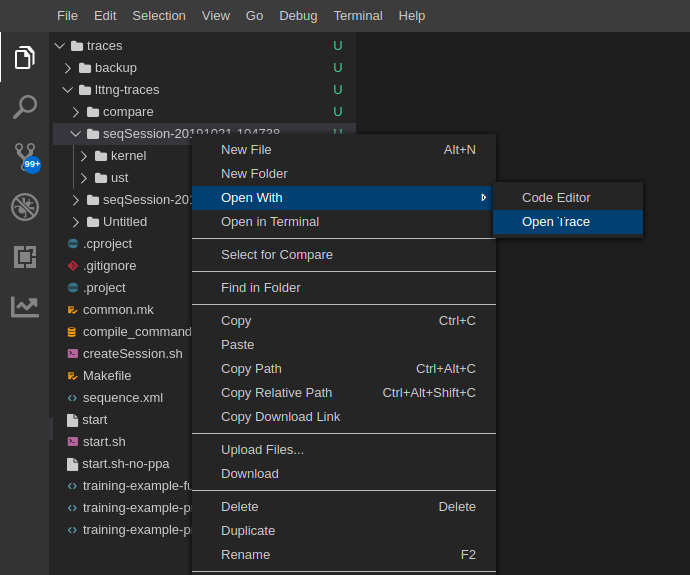
To open a trace in the Theia Trace Extension, use the File Explorer in Theia to navigate to the trace directory. Then right-mouse click on the trace and select menu Open With->Open Trace.
If the selection is a single file, then the tool will open the file directly as a trace.
If the selection is a directory, then the tool will look for traces in Common Trace Format (CTF) format, such as Linux Tracing Toolkit traces (LTTng) Kernel and UST (Userspace) traces, and open all found CTF traces together under the same timeline. The trace events of each CTF trace will be analyzed in chronological order. With this you're able to open e.g. LTTng Kernel and UST Traces at the same time.
The example Trace Compass trace server above supports LTTng Kernel and UST traces. Example LTTng traces can be retrieved from the Trace Compass Tutorials. Just download the archive TraceCompassTutorialTraces, extract them into a local directory on your computer. They can also be automatically downloaded by running yarn download:sample-traces from the repository's root.
To open the Trace Viewer, select menu View from the top-level menu and then select Trace Viewer in the list of views. Then the Trace Viewer icon will be added on the left navbar, below the File Explorer Icon.
Select the Trace Viewer icon to switch to the trace viewer.
Now, you will see 3 sections: Opened Traces, Available Views and Time Graph Tooltip. Select the trace that you opened and the available views will be populated. Now you can select different views and they will be added into a single container view for that trace.
There is only a limited number of such operations and they are only implemented in the Time Graph views (the ones looking like Gantt charts). For Zoom-in/out use CTRL+mouse wheel. Or use left mouse drag on time axis on top. Navigating the trace you can use the scrollbar at the bottom of the trace timeline container.
Currently, the Time Graph Tooltip is populated when selecting a state in a Time Graph view.
- Check out the tracevizlabs. You don't need to complete all of them, but reading a couple is good context. Lab sets 0 and 1 are especially useful.
- Browse recent conference presentations. They give an overview of the trace viewer's goals, architecture, and functionality.
- Using Theia to take trace analysis and visualization to the next level, slides, video - Bernd Hufmann, Ericsson AB (EclipseCon 2019)
- A New Flexible Architecture for Trace Compass, slides, video - Michel Dagenais, Polytechnique Montréal (Tracing Summit 2019)
- Get an overview of external components used by this trace viewer. See how they interact.
- Explore the Gitpod demo. Experiment with the trace viewer. Start exploring its code via Gitpod's in-browser IDE.
- Start with a small frontend improvement. A relevant change can be less than 5 lines of code. The Theia-based frontend repo is much less complex than the Trace Server's, so by starting in the frontend you'll learn high-level context about the project's different components without being overwhelmed with complexity.
- Good first issues
- Develop with Gitpod to initially avoid dev setup. Put
gitpod.io/#before your project fork's github URL to open an in-browser IDE and initially avoid any local dev setup. This dev approach works best for small changes because Gitpod workspaces are volatile. - Learn how to contribute code. Starting with a tiny change means you can first focus on exploring the code as well as learning the submission and review process (which is a significant learning step if you've never submitted a PR before).
Changes to the project are made by submitting code with a pull request (PR).
Good commit messages make it easier to review code and understand why the changes were made. Please include a:
- Title: Concise and complete title written in imperative (e.g. "Update Gitpod demo screenshots" or "Single-click to select or open trace")
- Problem: What is the situation that needs to be resolved? Why does the problem need fixing? Link to related issues (e.g. "Fixes #317").
- Solution: What changes were made to resolve the situation? Why are these changes the right fix?
- Impact: What impact do these changes have? (e.g. Numbers to show a performance improvement, screenshots or a video for a UI change)
- Sign-off: Use your full name and a long-term email address. This certifies that you have written the code and that, from a licensing perspective, the code is appropriate for use in open-source.
Other commit information:
This trace viewer depends on code from several other repos. Sometimes resolving issues in the trace viewer repo requires making changes in these code bases:
| Project | Description | Related issues | Links |
|---|---|---|---|
| Theia | Theia is a framework for making custom IDEs. It provides reusable components (ex. Text editor, terminal, etc.) and is extensible. For example, this trace viewer is an extension for Theia-based IDEs. | Code, Ecosystem | |
| Trace Compass | Trace analysis tool and precursor to this trace viewer. | label:"Trace Compass" | Dev info, Dev setup |
| Trace Compass Server | A reference implementation of a Trace Server. Manages and analyzes trace files and provides this data to the trace viewer over the Trace Server Protocol (TSP). This Trace Server implementation was originally part of Trace Compass so it requires the same dev setup. Because a protocol is used for communication (TSP), it is possible to develop alternative Trace Servers that are independent of Trace Compass. | label:"Trace Server" | Dev setup (same as Trace Compass), Code (same repo as Trace Compass incubator) |
| Trace Server Protocol (TSP) | Protocol used by the trace viewer to communicate with the trace server. | label:"trace server protocol" | |
| Client-side Trace Server Protocol implementation | A client-side implementation of the Trace Server Protocol. Allows the trace viewer to communicate with the server. | ||
| Timeline Chart | Implements the Gantt charts used in this trace viewer. | label:timeline-chart |


