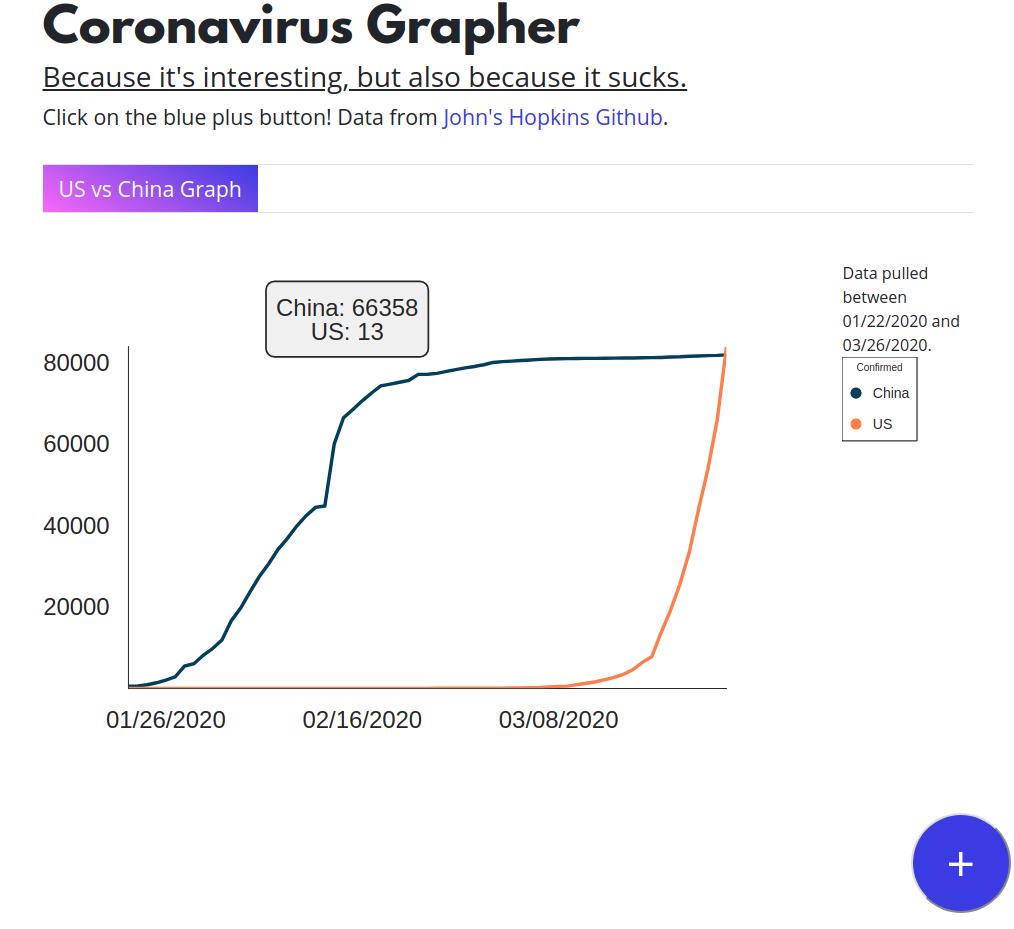
This is a toy project that I'm doing as a way to get used to some advancements in React and to get a better grasp of how crazy this situation is (I'm talking Corona here).
Its not super pre-architected so there's a lot to be desired, but it works (I pivoted the app format in the middle of development).
That said, if you're curious about how bad Coronavirus is doing in different countries/provinces, this code will let you compare them.
 Sort of like above. You can add new graphs and choose countries/provinces to compare along with date range.
You have the option of using various chart types including:
- Line
- Line (confirmed vs confirmed delta)
- Pie
- Stacked Bar
- Stacked Area
Some of the chart implementations are not perfect, but are based on some examples from Victory. The Line charts are probably the best implemented at the moment.
The most useful ones are Line and Line (confirmed vs confirmed delta). The latter uses ideas from here. The idea is that it can measure the velocity at which the virus is spreading on a log scale. Thus, it shows whether things are slowing down.
Backend:
- Adonis (Laravel in Node.js)
- GraphQL Server from Apollo
- SQL of choice (MySQL works, Sqlite probably does too)
Frontend:
- React / React starter kit
- Functional components (more hooks, no redux)
- Apollo Client/Cache
- Victory from Formidable
- Momentjs
- Bootstrap / React Bootstrap and friends
- SASS (barely)
Johns Hopkins Github: https://github.com/CSSEGISandData/COVID-19/tree/master/csse_covid_19_data/csse_covid_19_time_series
npm installin both theapiandclientdirectoriesnpm i -g @adonisjs/clito install the adonis client- Go into the api directory and run:
adonis migration:run - Make sure to look at the
env.examplefile in the api dir and make your own version as.envinside of theapidir. (I have this working with MySQL, but it should work out of the box with sqlite if you're not in a position to standup a real SQL server.) If the configs aren't exactly working for you, checkout the Adonis js docs: https://adonisjs.com/ - Run
adonis processThis downloads the covid data and puts it into your SQL DB of choice. It should take a moment. npm startin both places using two terminal windows- The client portion should just open a window for you.
- Mess around with it.
Its now up at https://corona.noindex.co
Yup, I haven't had time to add in validation. I'm working on it. No tests either. I'm probably going to re-write the input code.
Sometimes the Johns Hopkins folks change the data structure so if it stops running right, it might be that. Or you need to check your .env config.
I like Laravel. But I like Node.js better than PHP. Also, Adonis offers a built-in command builder which is super handy when you're working on a project like this that needs to have data reloaded every day.