WebGLRenderer: Use faster program cache key computation. #22530
Comments
It's important to clarify that it is not a material but a program cache key. And identifying the correct program depends on many factors. I doubt it makes sense to implement the key computation on app level since you have to honor all the information from the rendering process like the engine currently does. Out of curiosity: Can you please share a live example that demonstrates how you would implement a callback like In general, the shader program key computation is a technical detail of the engine that should not be exposed to the app. I would rather try to figure out how to optimize the existing implementation.
We often thought about this but could not come up with a different solution. Can you please make a concrete suggestion that explains how the cache key computation could be implemented differently? |
|
If I understand correctly, |
I agree, I think having a custom key computation solution is a gapstop that lets people solve the problem themselves, but opens up an avenue for people to shoot themselves in the foot.
Sure, there are plenty of shaders that are not affected by light/shadow, for example post-process shaders or various compute shaders (transform feedback). Even for standard materials, I can keep track of their equality, and when a "new" material is created - I can simply return an incremented integer. Think "hash map", similar to the current implementation in the sense that it keeps a key, but unlike three.js solution which has to be generic and doesn't know when a material changes - I have full knowledge of how my app works, so I can decide when to update the key.
something like this: class MaterialFingerprint{
....
match(material:Material):boolean // check if a given material/shader matches the fingerprint
fromMaterial(material:Material):void // populate fingerprint from a material/shader
}where |
|
The important question is how would you compute the program key differently. I'm afraid that is not yet clear from your post. |
For my own app? - I wouldn't. I'd keep something like an object ID and de-dupe shaders myself. For generic three.js solution? - there are many options. One step would be to separate existing giant array into logical pieces, assign those to separate fields of the here's roughly how the key is being computed now: const key_array : string[] = [];
const part_a : string = compute_program_property_A(program);
key_array.push(part_a);
const part_b : string = compute_program_property_B(program);
key_array.push(part_b);
...
const key_string = key_array.join();One simple optimization here is not to build the last string and not to create the array. How? like so: class MaterialFingerprint{
private property_a:string
private property_b:string
...
match(program){
if(this.property_a !== compute_program_property_A(program)){
return false;
}
if(this.property_b !== compute_program_property_B(program)){
return false;
}
return true;
}
}You get early rejection and don't have to materialize the key every time, |
|
Here's a small addition to what was already mentioned, here's the memory allocation trace for similar scene: You'll see that 68.5% of the garbage generated throughout normal running of the app comes just from that single area. The trace duration is just around 20s, there's 1,246,672 bytes of related garbage from those two functions or around 63kb of garbage per second. It's not super significant by itself, but since there are a lot of strings, which take up varied amount of space - it will cause a lot of heap fragmentation and will make GC pauses longer in general. |

|
We can make the function faster presumably, but if it's being called 5,000 times in 20s then something else seems wrong. Is it possible to tell if it was invoked the same number of times in the earlier three.js version? |
|
I don't know if this is a regression issue. I don't keep backwards compatibility generally. Sorry. |
|
I can reproduce a similar issue on the WebGL | Animation | Keyframes example, tracking back to #21788 (r129) and probably similar removals like In three.js/src/renderers/WebGLRenderer.js Lines 1565 to 1567 in 7f6a099 ...invoking So realistically there are two problems here:
I do think I like the @Usnul's suggestion in #22530 (comment). It would certainly result in less GC, and might also be faster. But I am hoping we can find a way to avoid calling |
|
I'm little worried about the added complexity of multiple cache keys, but one option might be to keep a cheaper "fastProgramCacheKey" to map a single material to its program variants. Since there are not many possible combinations there, it could just be a cheaper bit mask instead of a string. For example: const cacheKey = SKINNING & VERTEX_TANGENTS & MORPH_TARGETS; |
|
@donmccurdy is correct. Starting in r130, transparent, double-sided materials appear to suffer from this, for example. |
|
Something I was considering after the introduction of the Doesn't solve the particular problem being talked about here, but it helps a bit by moving out of the renderer the logic of deciding when a shader needs to be recomputed. |
|
getters/setters updating version would help. |
|
Just coming across this here also, specifically notable in larger 3d-tiles tilesets with custom shaders, each new tile/material allocating the string-concat key adds up QUITE quickly with thousands of tiles when unable to share material instances. 1: Is there a reason that something like the NodeMaterial.getHash wouldn't work as a lighter weight key than .joining the full fragment/vertex shaders? 2: Alternately, for custom ShaderMaterial/RawShaderMaterials or other items not existing in the ShaderLab index, if a material implements the customProgramCacheKey function, can that be used instead of the large concat? edit: in a little more digging, I see that the getHash() is not a general thing, and only returns the material uuid there, I start the see the crux ;) |
|
I did an experiment using a hashing function on the shader strings, and while I don't think this addressed the full set of problems mentioned in the initial issue, it certainly seems to address my own use case, which is streaming large 3d-tiles tilesets with custom RawShaderMaterials attached would allocate an unweildy amount of memory: #22650 |
|
Hello, looking forward for a fix. |
|
Continuing from #23106...
Note that #22960 and #23022 should improve the performance of |
At first, I think it's very easy to test through my example, just change the But on another more complex project, I really even get worse performance, lower fps after upgrade from r133 to r136, but hard to publish example. The main difference between the two projects is that: |


|
@gonnavis I'll have a look at your example to see what's going on between version r129 vs r136. |
|
@gonnavis I've looked into your example and noticed that you've added console.log call in the getProgramCacheKey function. console.log is a not very performant function. This function can take up to 100 microseconds for each call to 'console.log' when the devtools are open. I've created a testcase to show that this is a lot slower. Testcase => link This is my result without devtools open. This is my result with devtools open. I hope this shows that calling console.log has a big impact on the performance of javascript. So I've updated your examples to remove the call to console.log & to me it seems r129 and r136 perform a lot better than r135. r129 example =>comparision source code PS: the reason I don't look at the profiles of javascript is that they are inherently unreliable for comparison between codebases. The javascript profiler causes functions to deoptimize which make their performance drop a lot compared to other functions. As far as I could tell getProgramCacheKey, getShaderStage and getProgram in r136 are of those functions that are unoptimized. You can see this clearly when profiling the following example Webgl_performance_shader. This example for me drops from a stable 60FPS to an unstable 45-46fps. The drop in the middle of the image is when I created a javascript profile. |


|
Oh, I somewhat forgot the influence of devtool. I'll continue to test both projects, as well as your examples, and keep an eye on the impact of devtool. |
Like you said before, there were 2 issues surrounding getProgramCacheKey.
Both #22960 and #23022 only resolve the fact that getProgramCacheKey was very expensive in r135. This was also the target of the example webgl_performance_shader. The amount of calls to getProgramCacheKey is still more often than r129 and earlier versions. |
|
Added an r128 version, and adopted gero3's improvment to all version examples: r128: r129: r135: r136: Tough the call count of
According to my test results, it should be. |
|
I see no difference in FPS when using the above links. TBH, the shared URLs are no good test case for profiling the program cache key overhead since way too many things happen in your app. Please use an updated version of the simplified In general, the number of times |
|
Still surprised why the profiles of chrome devtool is sooo wrong, misleading Usnul and me to the wrong direction. Using another approach to check the performance, found that And the profiles is very unstable, I can't get the
|


|
@gero3 did a great job in I'm not surprised that the world matrix update routine consumes a lot of time, especially in complex scene graphs. However, this issue is know and was discussed multiple times in the project. The current recommendation is to set However, I'm not a fan of this policy because it is complicated and thus error-prone. The engine should solve this problem and not delegate this task to apps. Unfortunately, solving this issue requires changes in the engine which are not accepted by all project members. I doubt that we can make progress in this issue anytime soon. |
|
Oh, I only focused on the chrome devtool profiles' wrong result of
, but be profiled the top time consuming function at some situations. Let me to find out whether firefox or other browsers have similar functionalities, and what's the result. |
|
Made another example https://raw.githack.com/gonnavis/annihilate/GetProgramCacheKeyTimeVsUpdateMatrixWorldTime2/index.html I found that Firefox has the same problem, but better. |

|
Seems like the issue has been addressed. |
I've recently did a profile of my project, haven't done that in 4-5 months, since then three.js version has been upgraded several times. Currently on
0.132.2So, profile shows up that
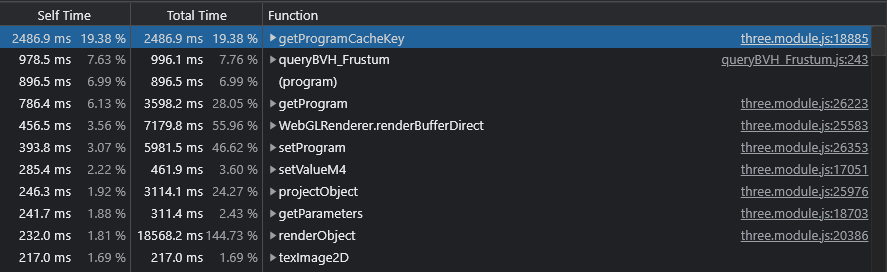
getProgramCacheKeytakes up close to 20% of the entire time:For a bit more context, this is in the scope of the entire game, with particle simulation, IK, sound and a bunch of other stuff going on. Not just pure rendering. Here's a screenshot of what's being rendered:

Here's the
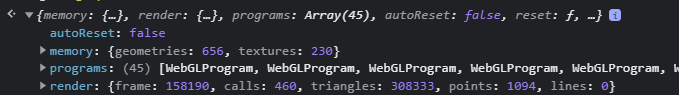
WebGLRenderer.info:If you have a look at the cache key computation code, there's a lot wrong there. It's building an array of strings, that's a lot of allocation, and then there's
array.join()which results in another string being created. All of that, just to throw the result away in the end (since no new materials are created during profiling period).I propose offering an override for the cache keys, or building keys in a way that avoids much of the allocation effort. Also, doing equality check on material against what's already cached can be done without materializing this "cache key" at all. I understand that it's "simple" to do what's currently being done, and I understand that doing what I propose is less easy, but we're talking about 20% of the CPU time being wasted on an application that's hardly pure rendering.
As an alternative - perhaps offer an override for cache key computation, something like "customComputeMaterialCacheKey", that would be dirty, but it would allow users like me to work around the issue.
The text was updated successfully, but these errors were encountered: