Artistic visualizations created with Mathematica and the Wolfram Language
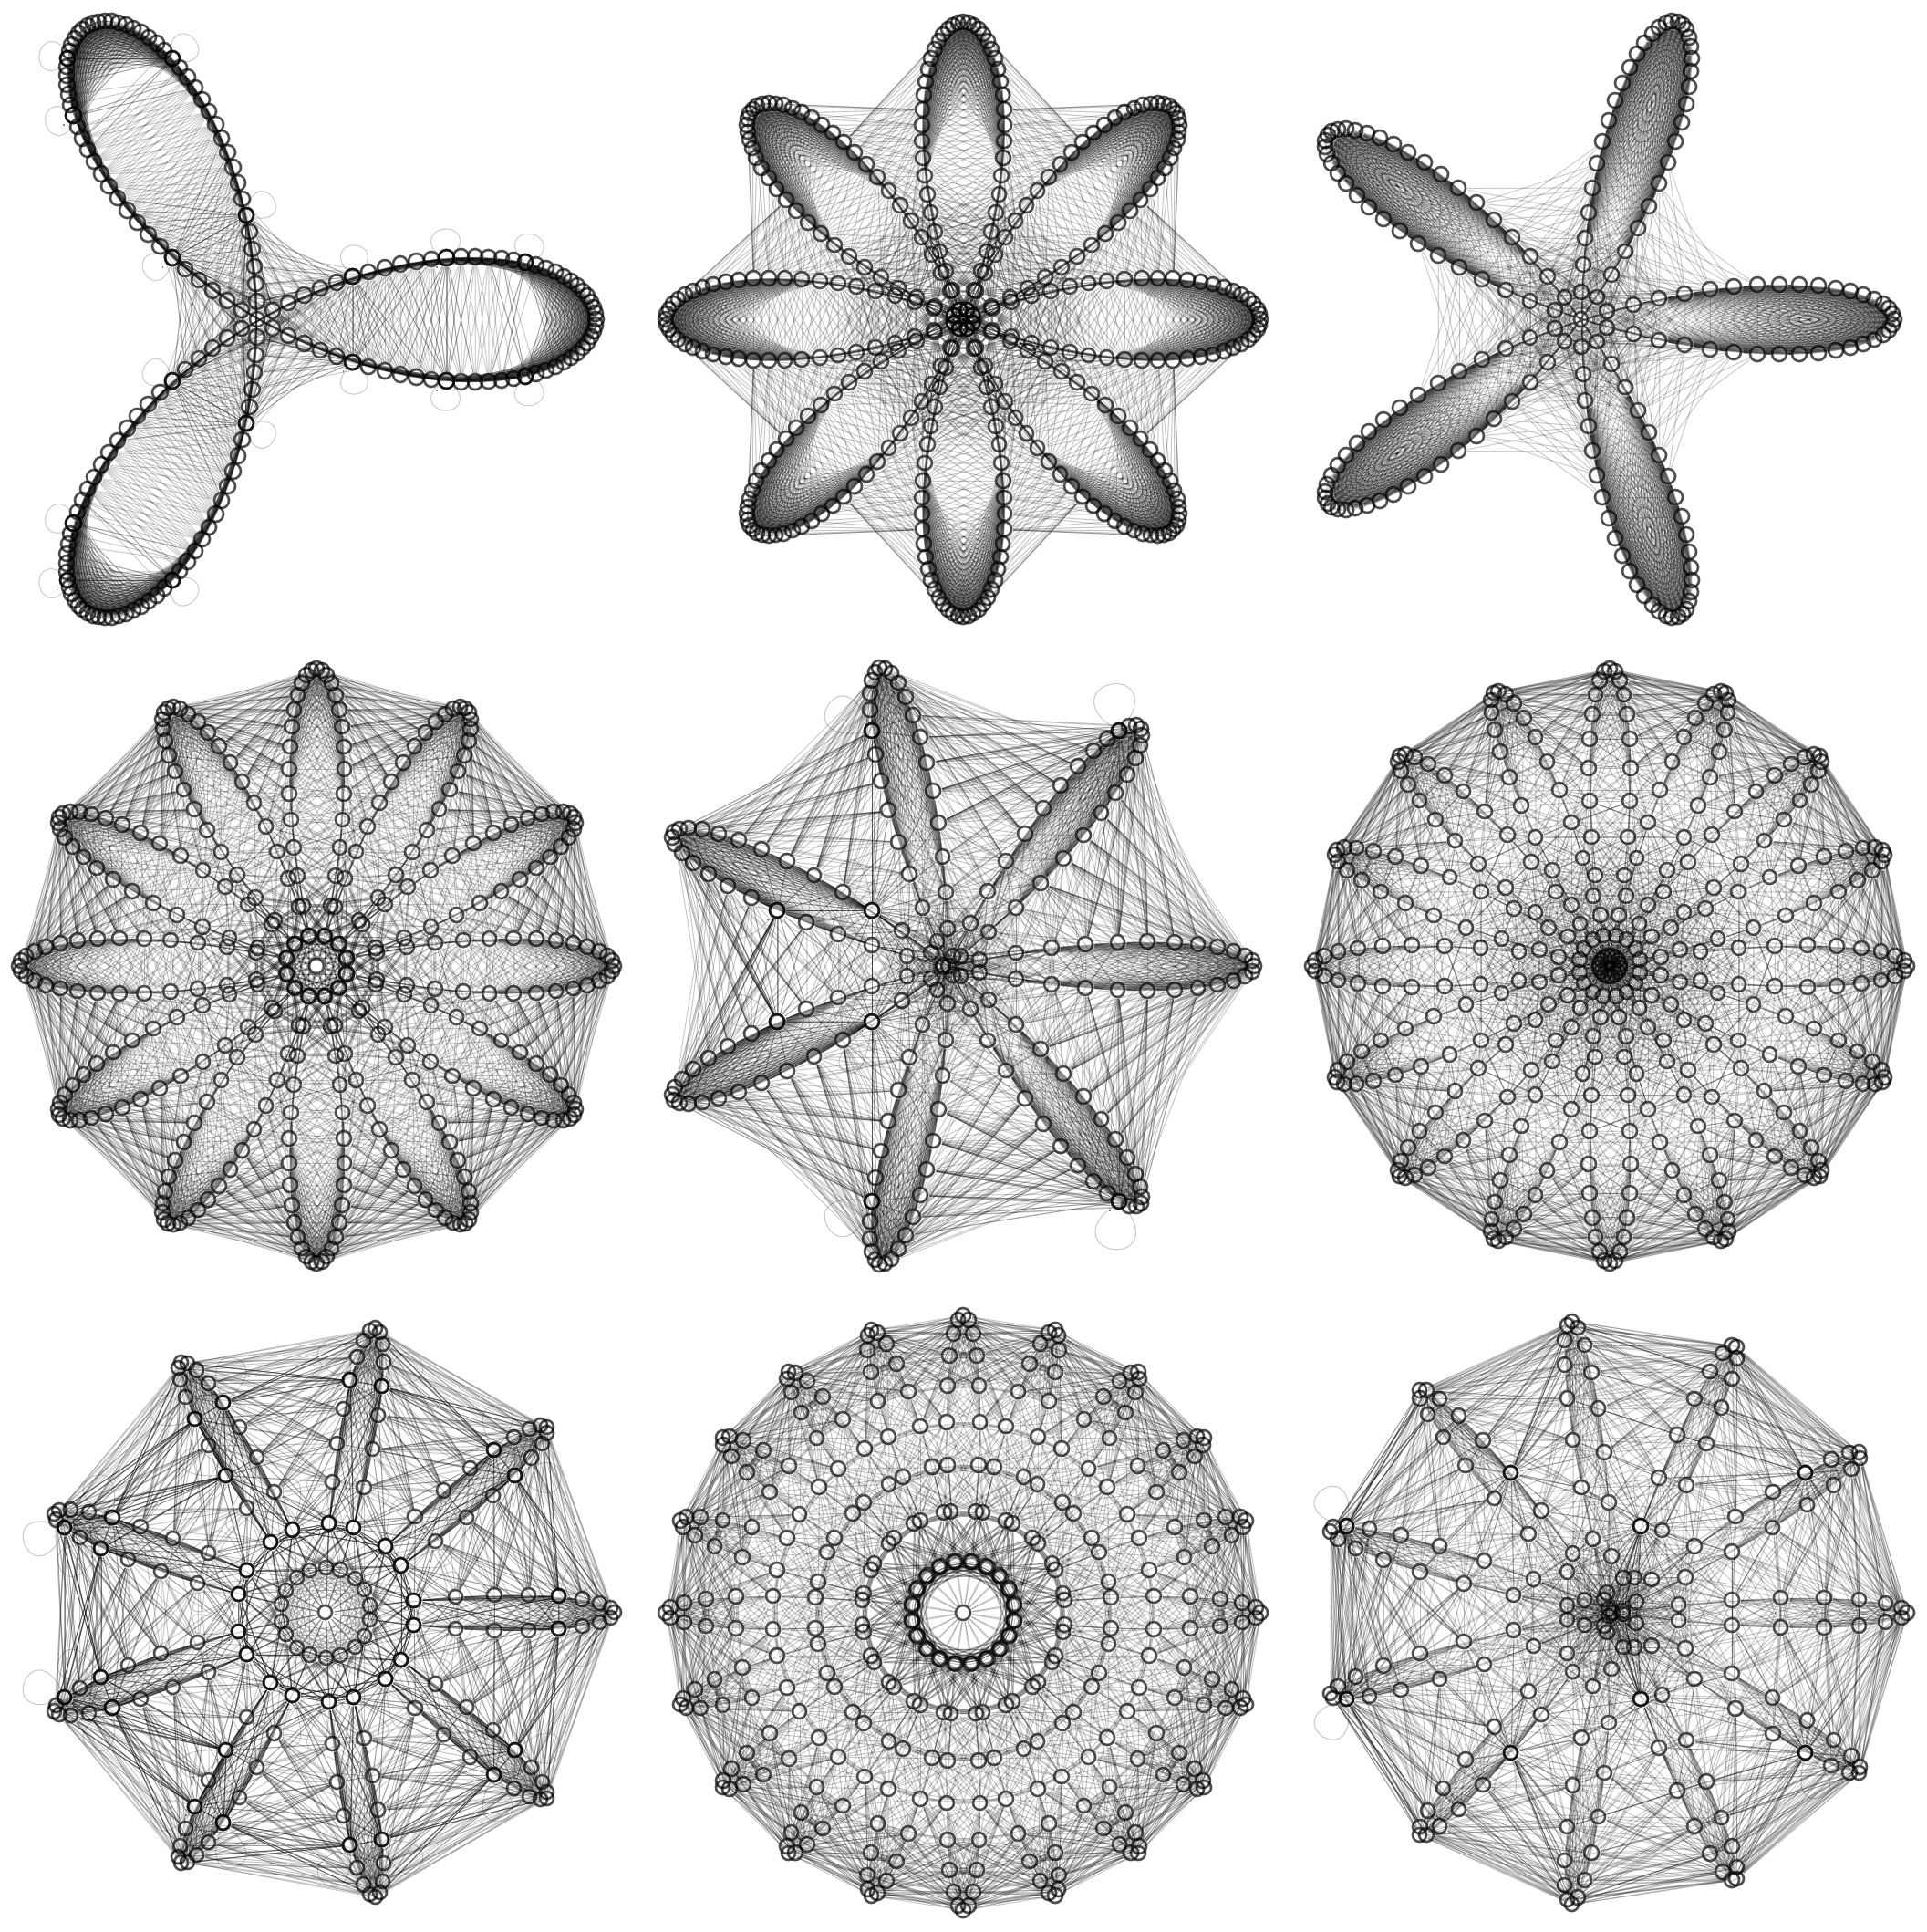
Grid[
 Partition[
  Table[
   Show[
    GraphPlot[
     NearestNeighborGraph[
      Table[
       {Cos[k*t]*Cos[t], Cos[k*t]*Sin[t]},
       {t, 0, 12 Pi, Pi/180}
      ],
      30,
      EdgeStyle -> Directive[Black, Thickness[0.0005]],
      ImagePadding -> 0,
      ImageSize -> {250, 250},
      PerformanceGoal -> "Quality",
      VertexStyle -> Transparent,
      WorkingPrecision -> MachinePrecision
     ]
    ]
   ],
   {k, 3, 11}
  ],
  3
 ]
]a = 62;
b = 90;
k = 28;
n = 1970;
points = Table[
{(a + b) Cos[t] - b Cos[(a/b + 1) t], y = (a + b) Sin[t] - b Sin[(a/b + 1) t]},
{t, 0, 96 Pi, 96 Pi/n}
];
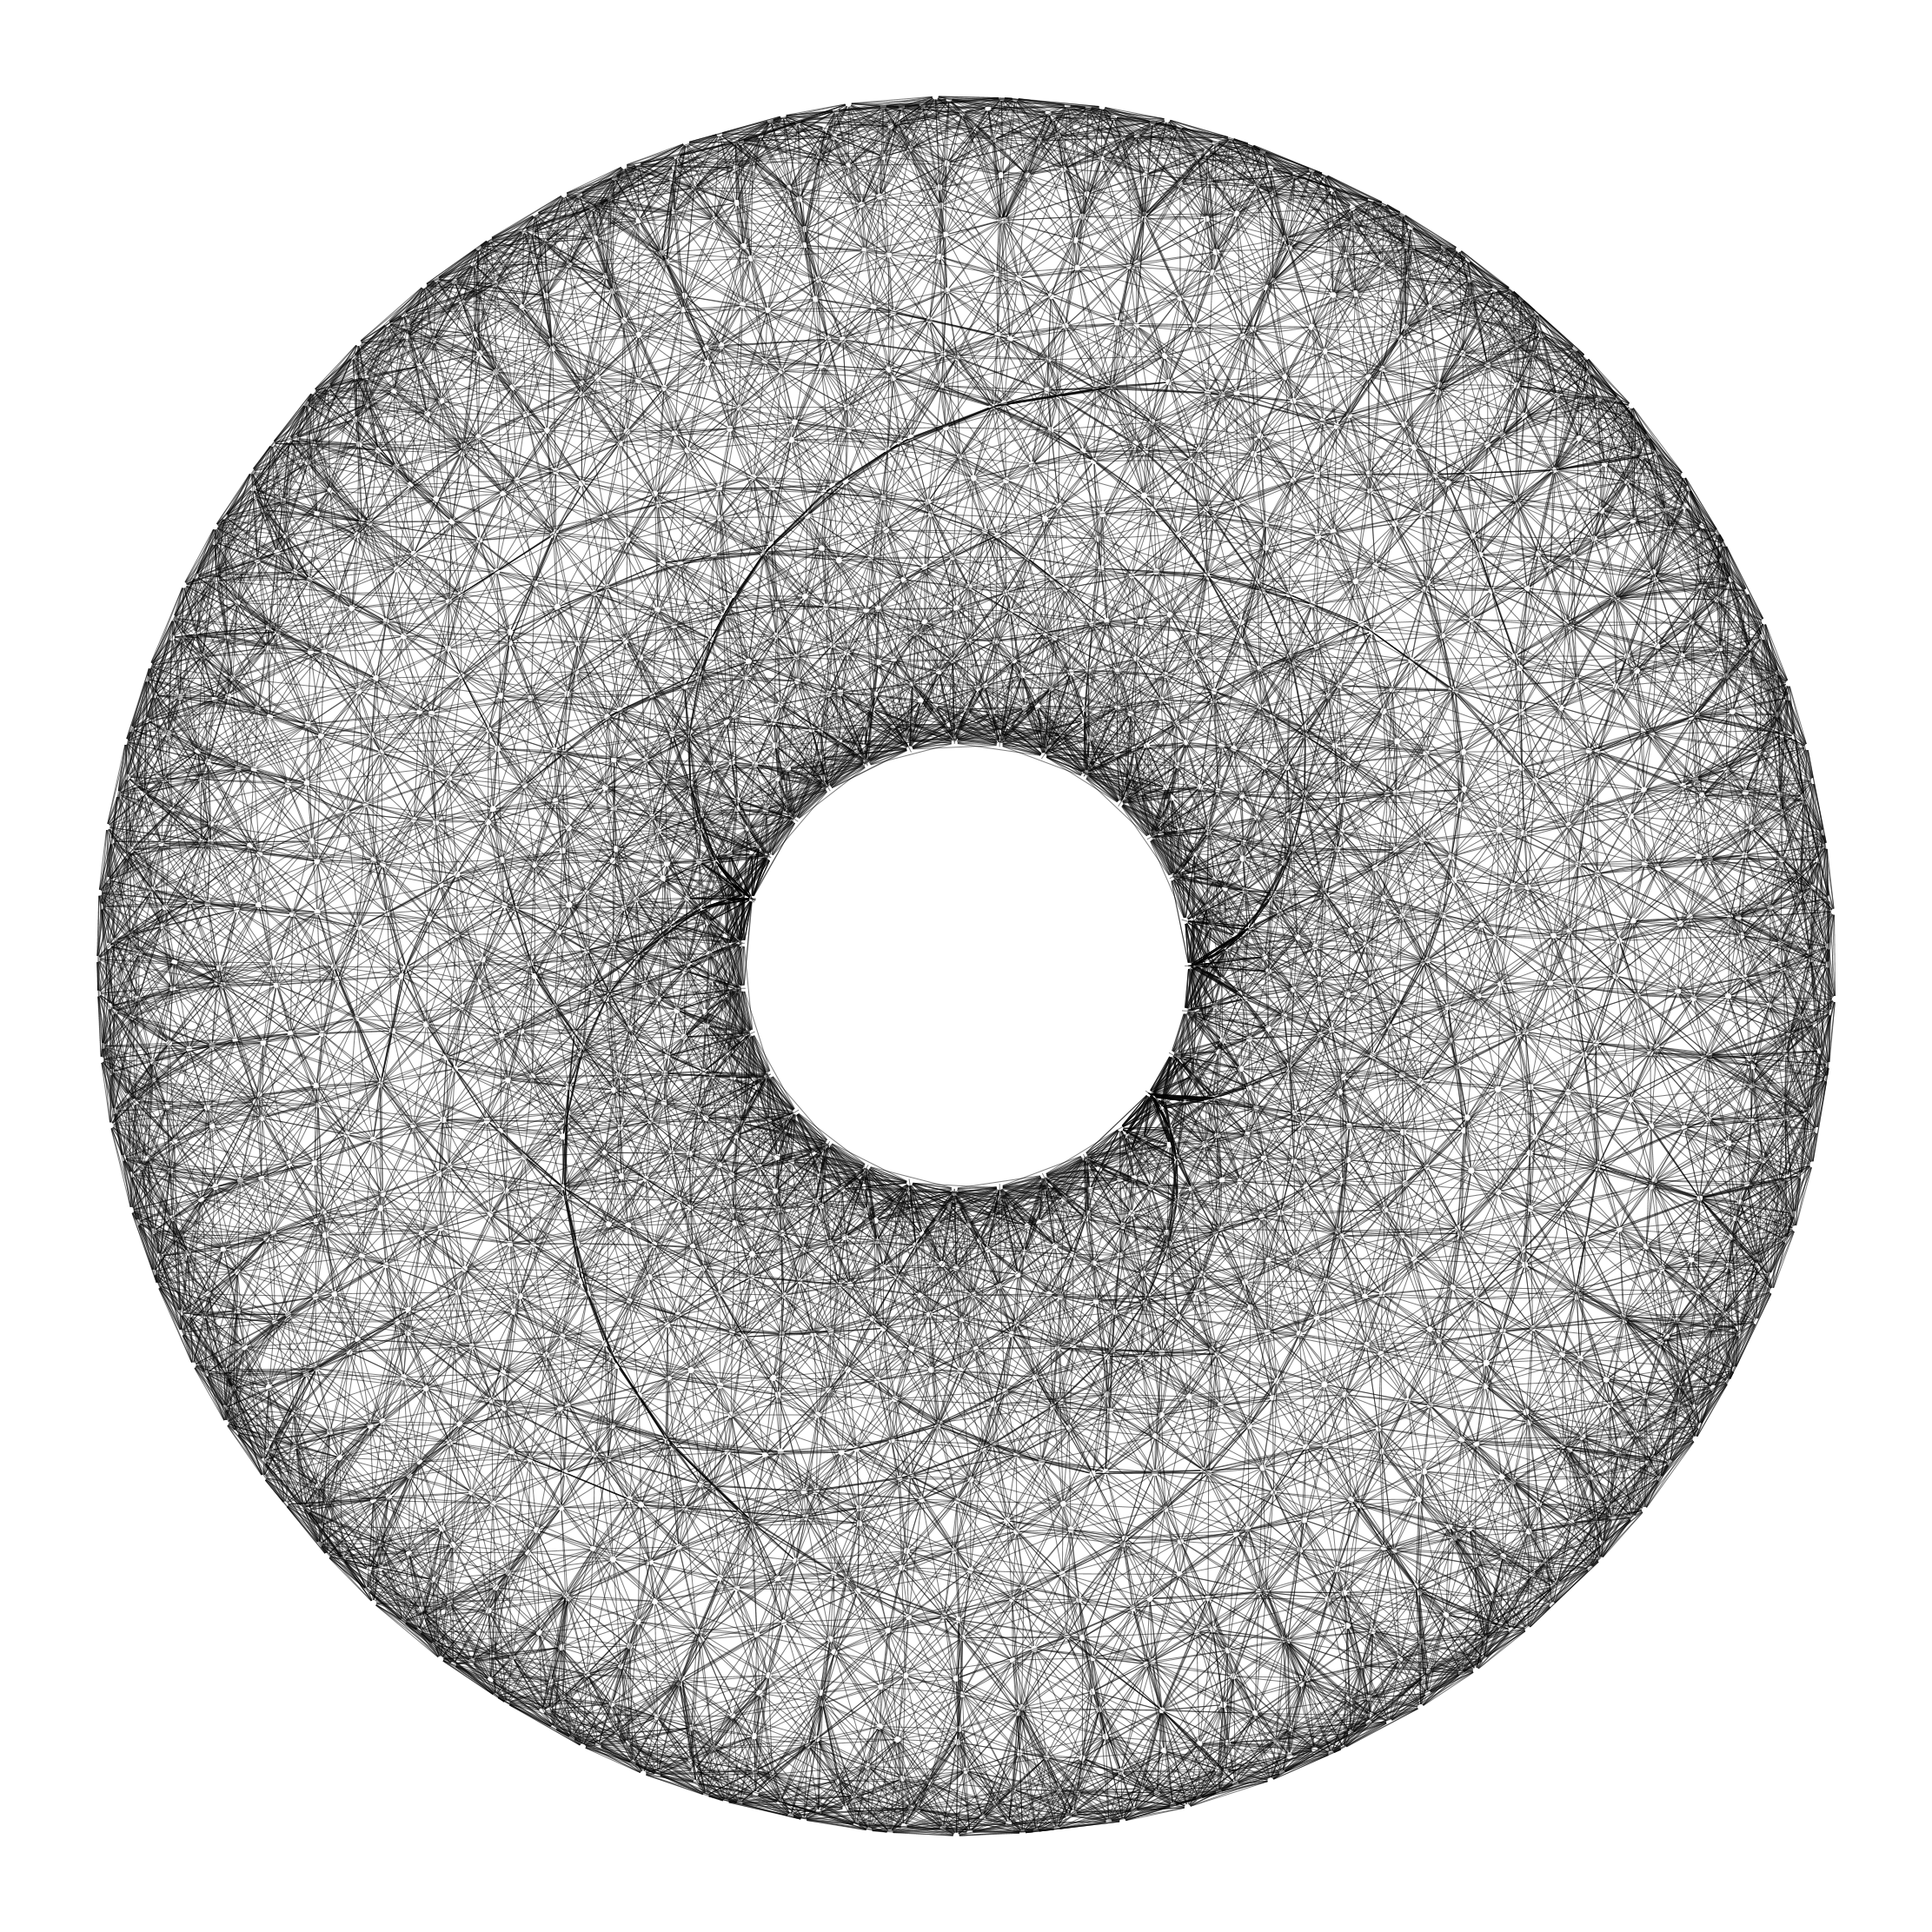
GraphPlot[
NearestNeighborGraph[
points,
k,
EdgeStyle -> Directive[Black, Thickness[0.0005]],
ImagePadding -> 25,
ImageSize -> {800, 800},
PerformanceGoal -> "Quality",
VertexStyle -> Transparent
]
]n = 10000;
m = 50;
s = 0.025;
c = {7.0, -8.7, 9.8, 4.4, -9.4, 4.7};
nextPoint = Function[xy,
x = xy[[1]];
y = xy[[2]];
dx = -2*(c[[1]] x + c[[2]] Sin[c[[3]] y]);
dy = -2*(c[[4]] y - c[[5]] Cos[c[[6]] x]);
d = Sqrt[dx^2 + dy^2];
xy + {dx, dy}*s/d
];
points = Table[
NestList[
nextPoint[#] &,
{Cos[i/n*2*Pi], Sin[i/n*2*Pi]},
m
],
{i, 1, n}
];
ListLinePlot[
points,
AspectRatio -> 1,
Axes -> False,
ImagePadding -> 5,
ImageSize -> {800, 800},
PlotStyle -> Directive[{Black, Thickness[0.00003]}]
]n = 10000;
m = 200;
s = 0.17;
a = -3.0;
b = -0.3;
nextPoint = Function[
xy,
dx = -(20 xy[[1]] + xy[[2]] + 60 Cos[a xy[[2]]]);
dy = -(-xy[[1]] + b xy[[2]] - 60 Cos[a xy[[1]]]);
d = Sqrt[dx^2 + dy^2];
xy + {dx, dy}*s/d
];
points = Table[NestList[nextPoint[#] &, RandomReal[{-10, 10}, 2], m], n];
ymax = Max[points];
plot = ListLinePlot[
points,
AspectRatio -> 1, Axes -> False,
ImagePadding -> 25, ImageSize -> {800, 800},
PlotRange -> {{-ymax, ymax}, {-ymax, ymax}},
PlotStyle -> Directive[{Black, Thickness[0.00003]}]
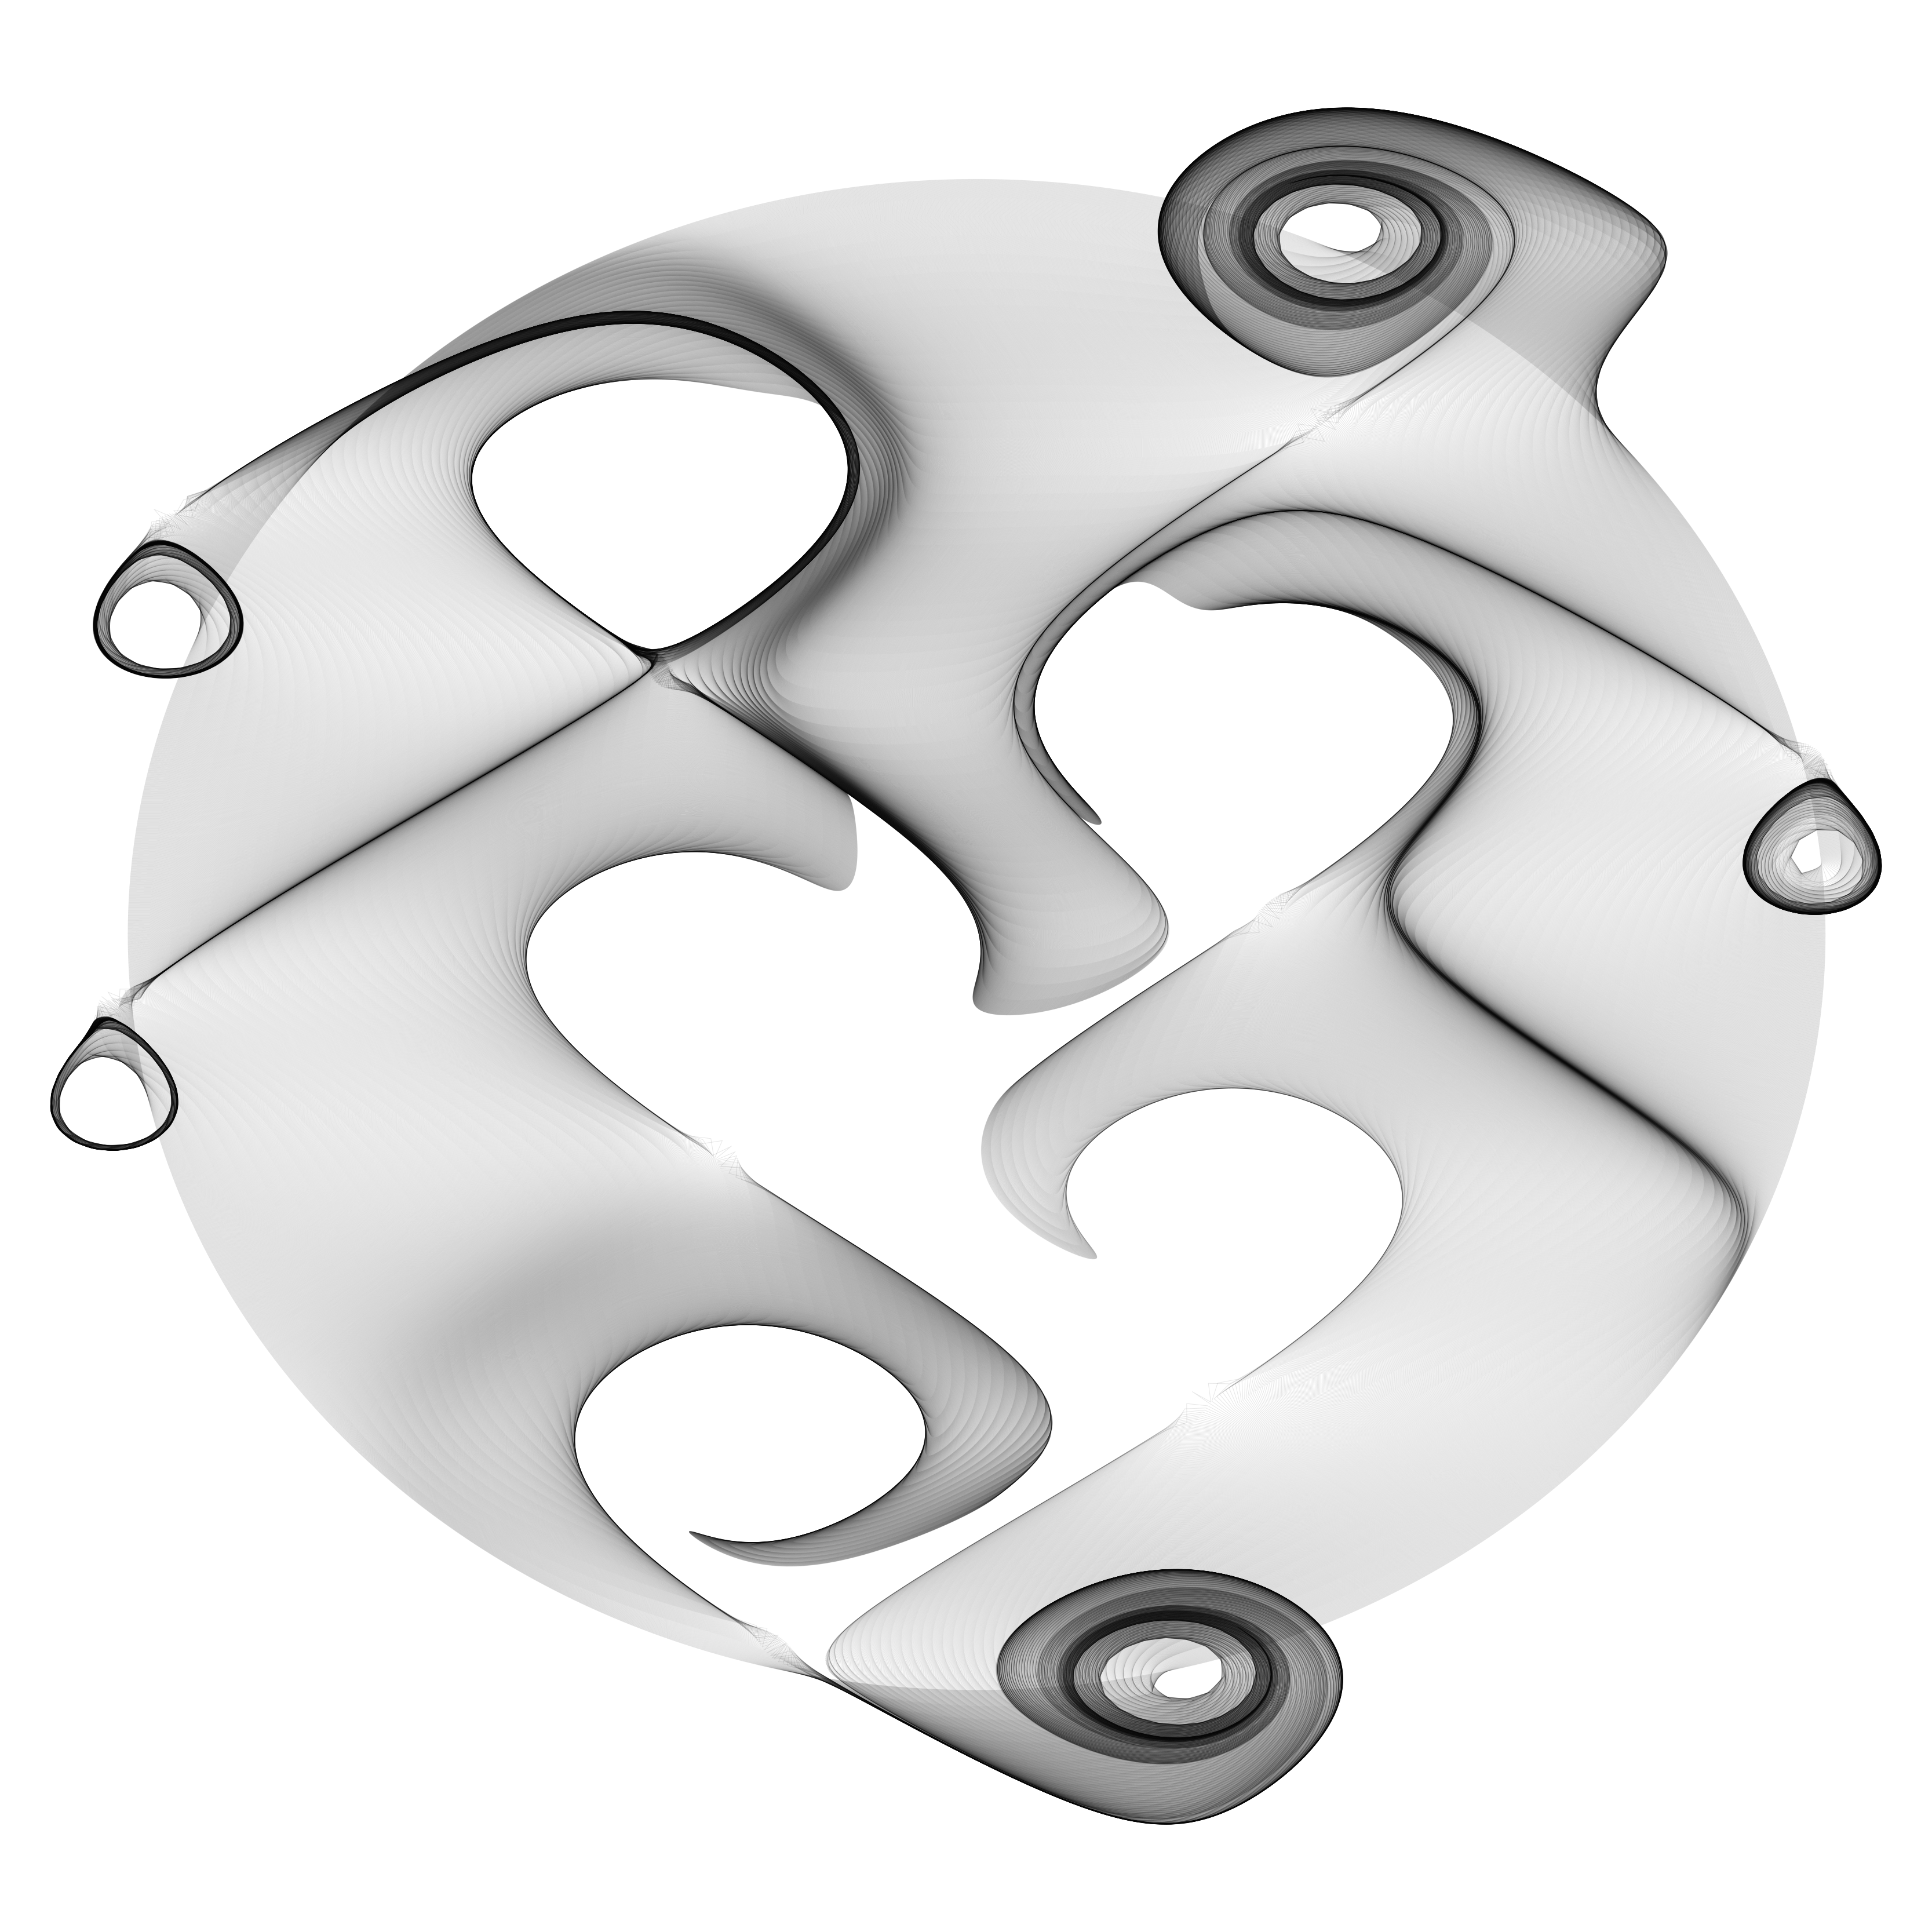
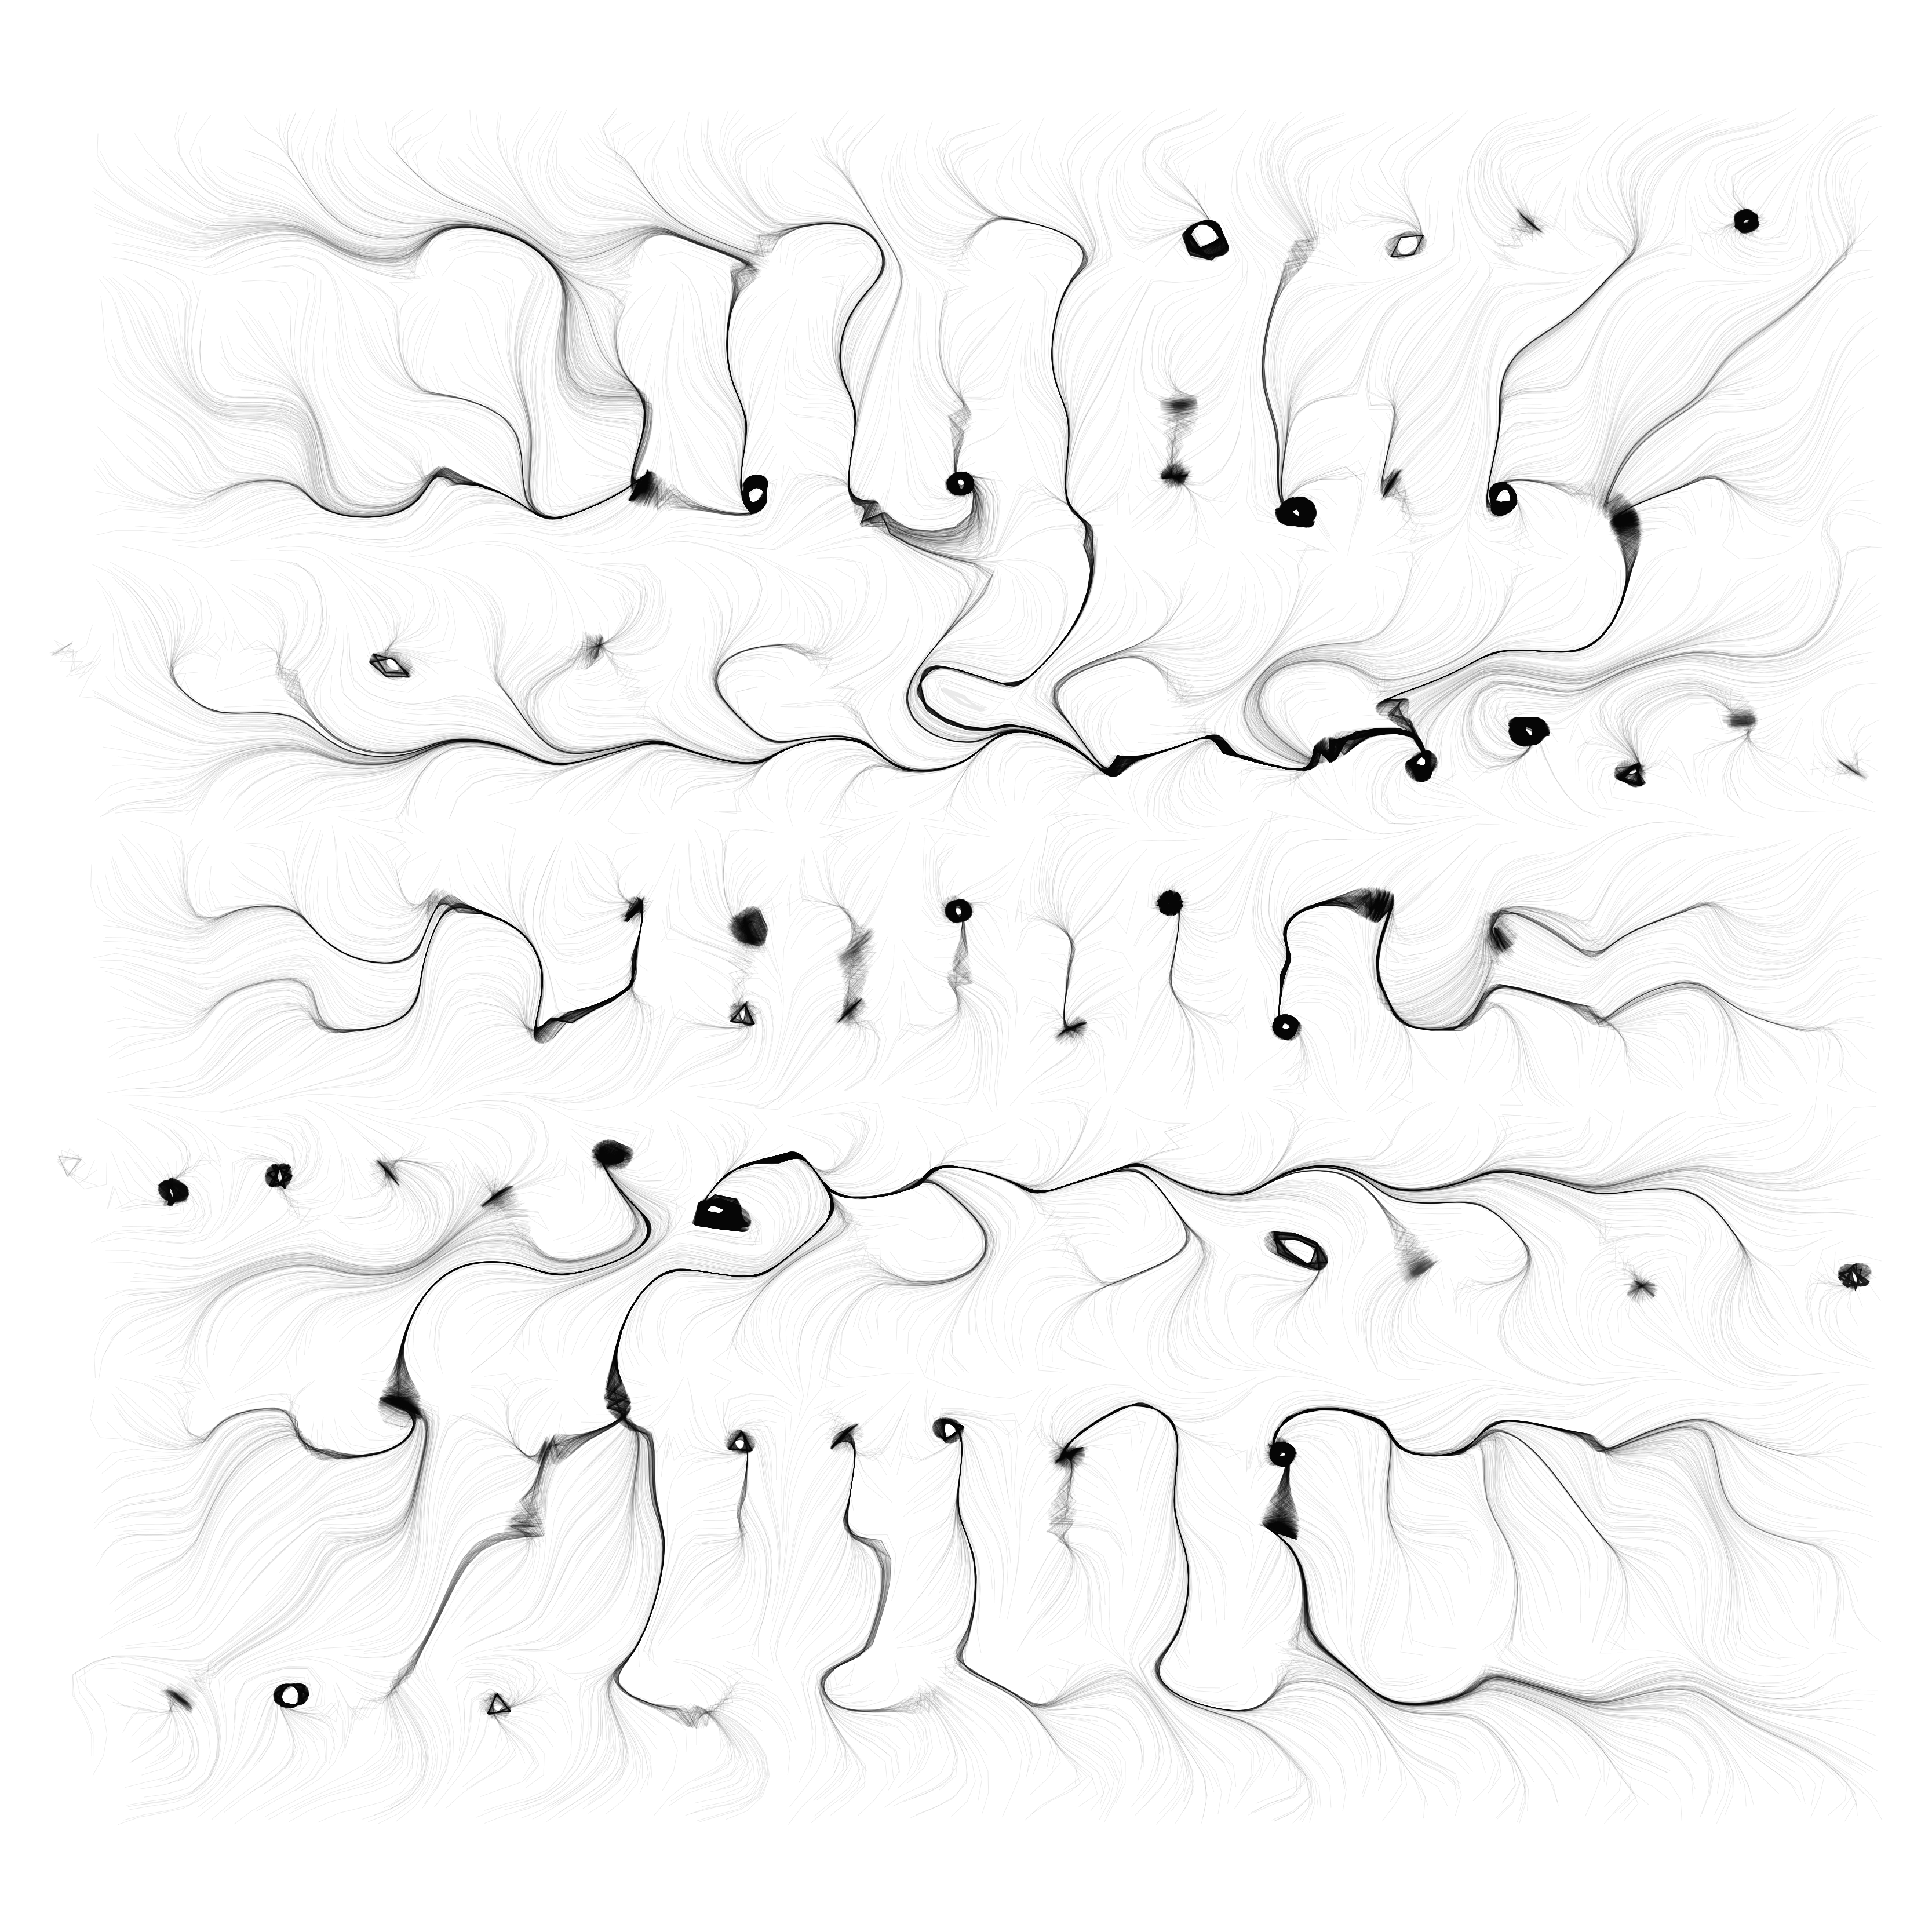
]Trajectories of particles moving across a vector flow field.
n = 10000;
m = 200;
s = 0.05;

nextPoint = Function[
 xy,
 dx = -10*(xy[[1]] + Sin[-15*xy[[2]]] - Sin[-10*xy[[2]]] + Cos[25*xy[[1]]]);
 dy = -10*(xy[[2]] - Sin[-10*xy[[2]]] - Sin[20*xy[[2]]] - Cos[15*xy[[1]]]);
 d = Sqrt[dx^2 + dy^2];
 xy + {dx, dy}*s/d
];

points = Table[NestList[nextPoint[#] &, RandomReal[{-2, 2}, 2], m], n];

ListLinePlot[
 points,
 AspectRatio -> 1,
 Axes -> False,
 ImagePadding -> 5,
 ImageSize -> {800, 800},
 PlotStyle -> Directive[{Black, Thickness[0.000025]}]
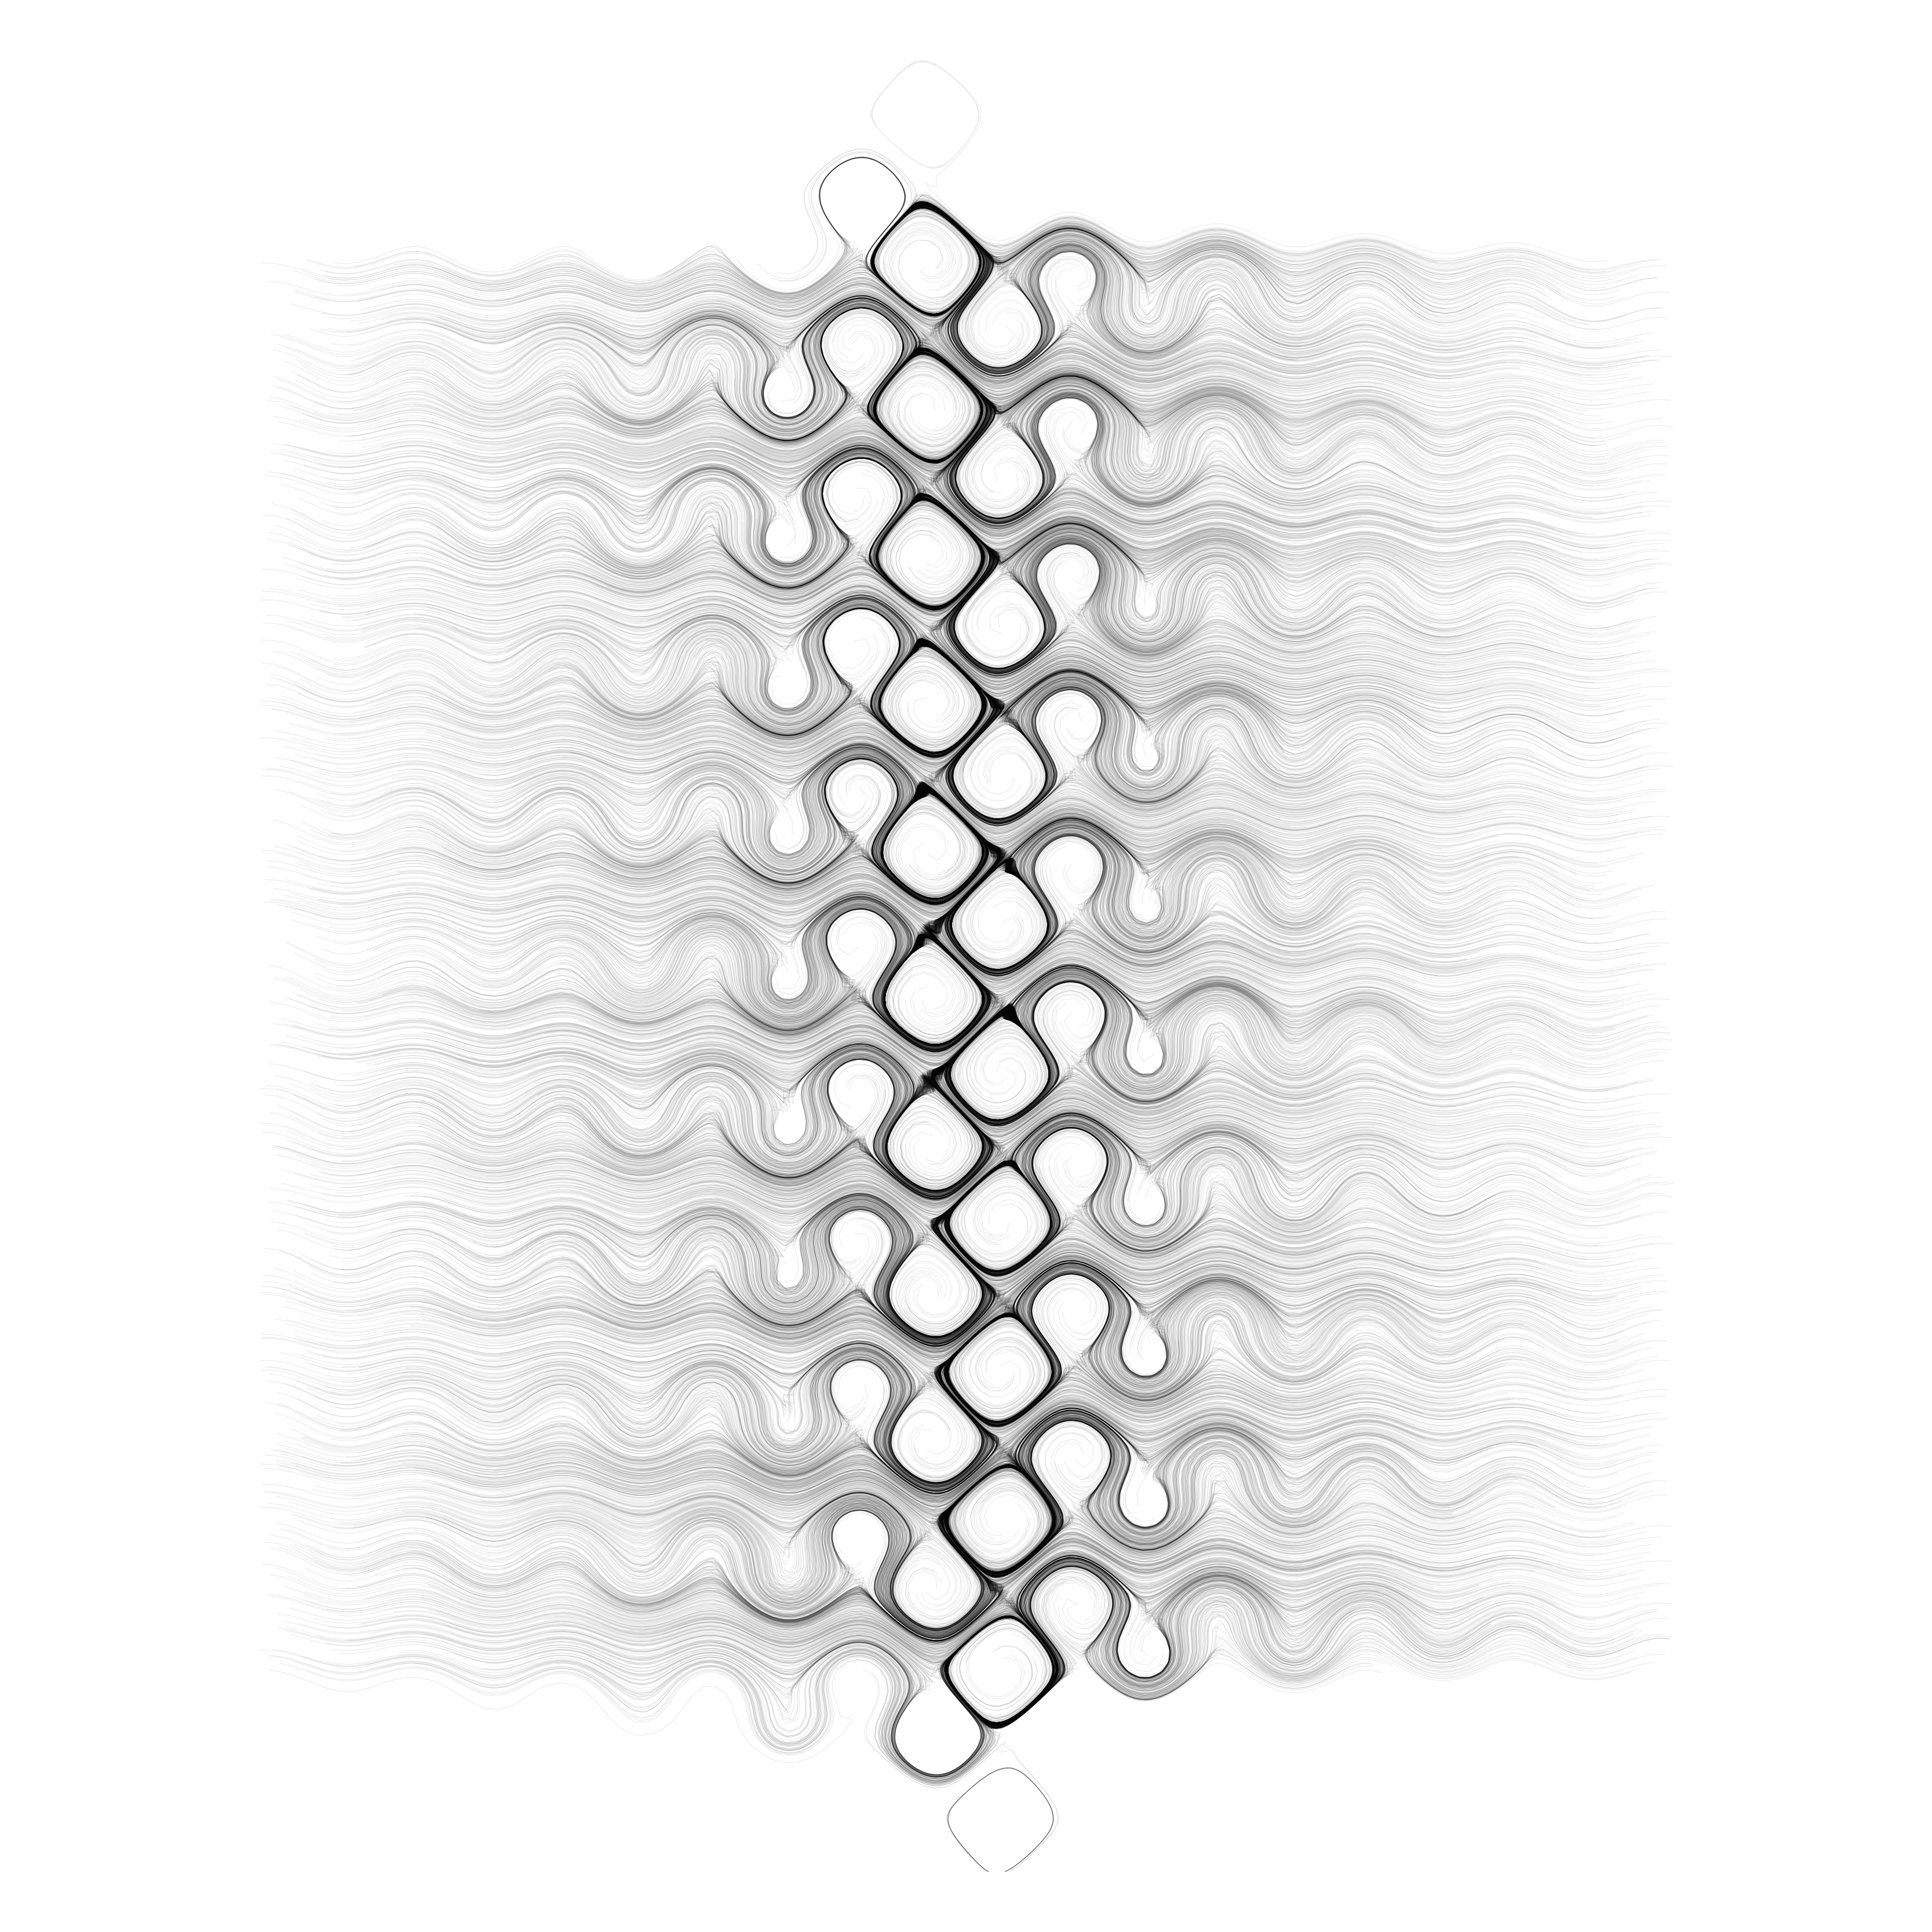
]Trajectories of particles moving across a vector flow field.
n = 10000;
m = 200;
s = 0.005;

nextPoint = Function[xy,
 dx = -Cos[10*xy[[2]]^2]^3;
 dy = -Sin[10*xy[[1]]^2*xy[[2]]]^3;

 d = Sqrt[dx^2 + dy^2];

 xy + {dx, dy}*s/d
];

points = Table[
 NestList[
  nextPoint[#] &,
  RandomReal[{-4, 4}, 2],
  m
 ],
 n
];

ListLinePlot[
 points,
 AspectRatio -> 1,
 Axes -> False,
 ImagePadding -> 5,
 ImageSize -> {800, 800},
 PlotStyle -> Directive[{Black, Thickness[0.00025]}]
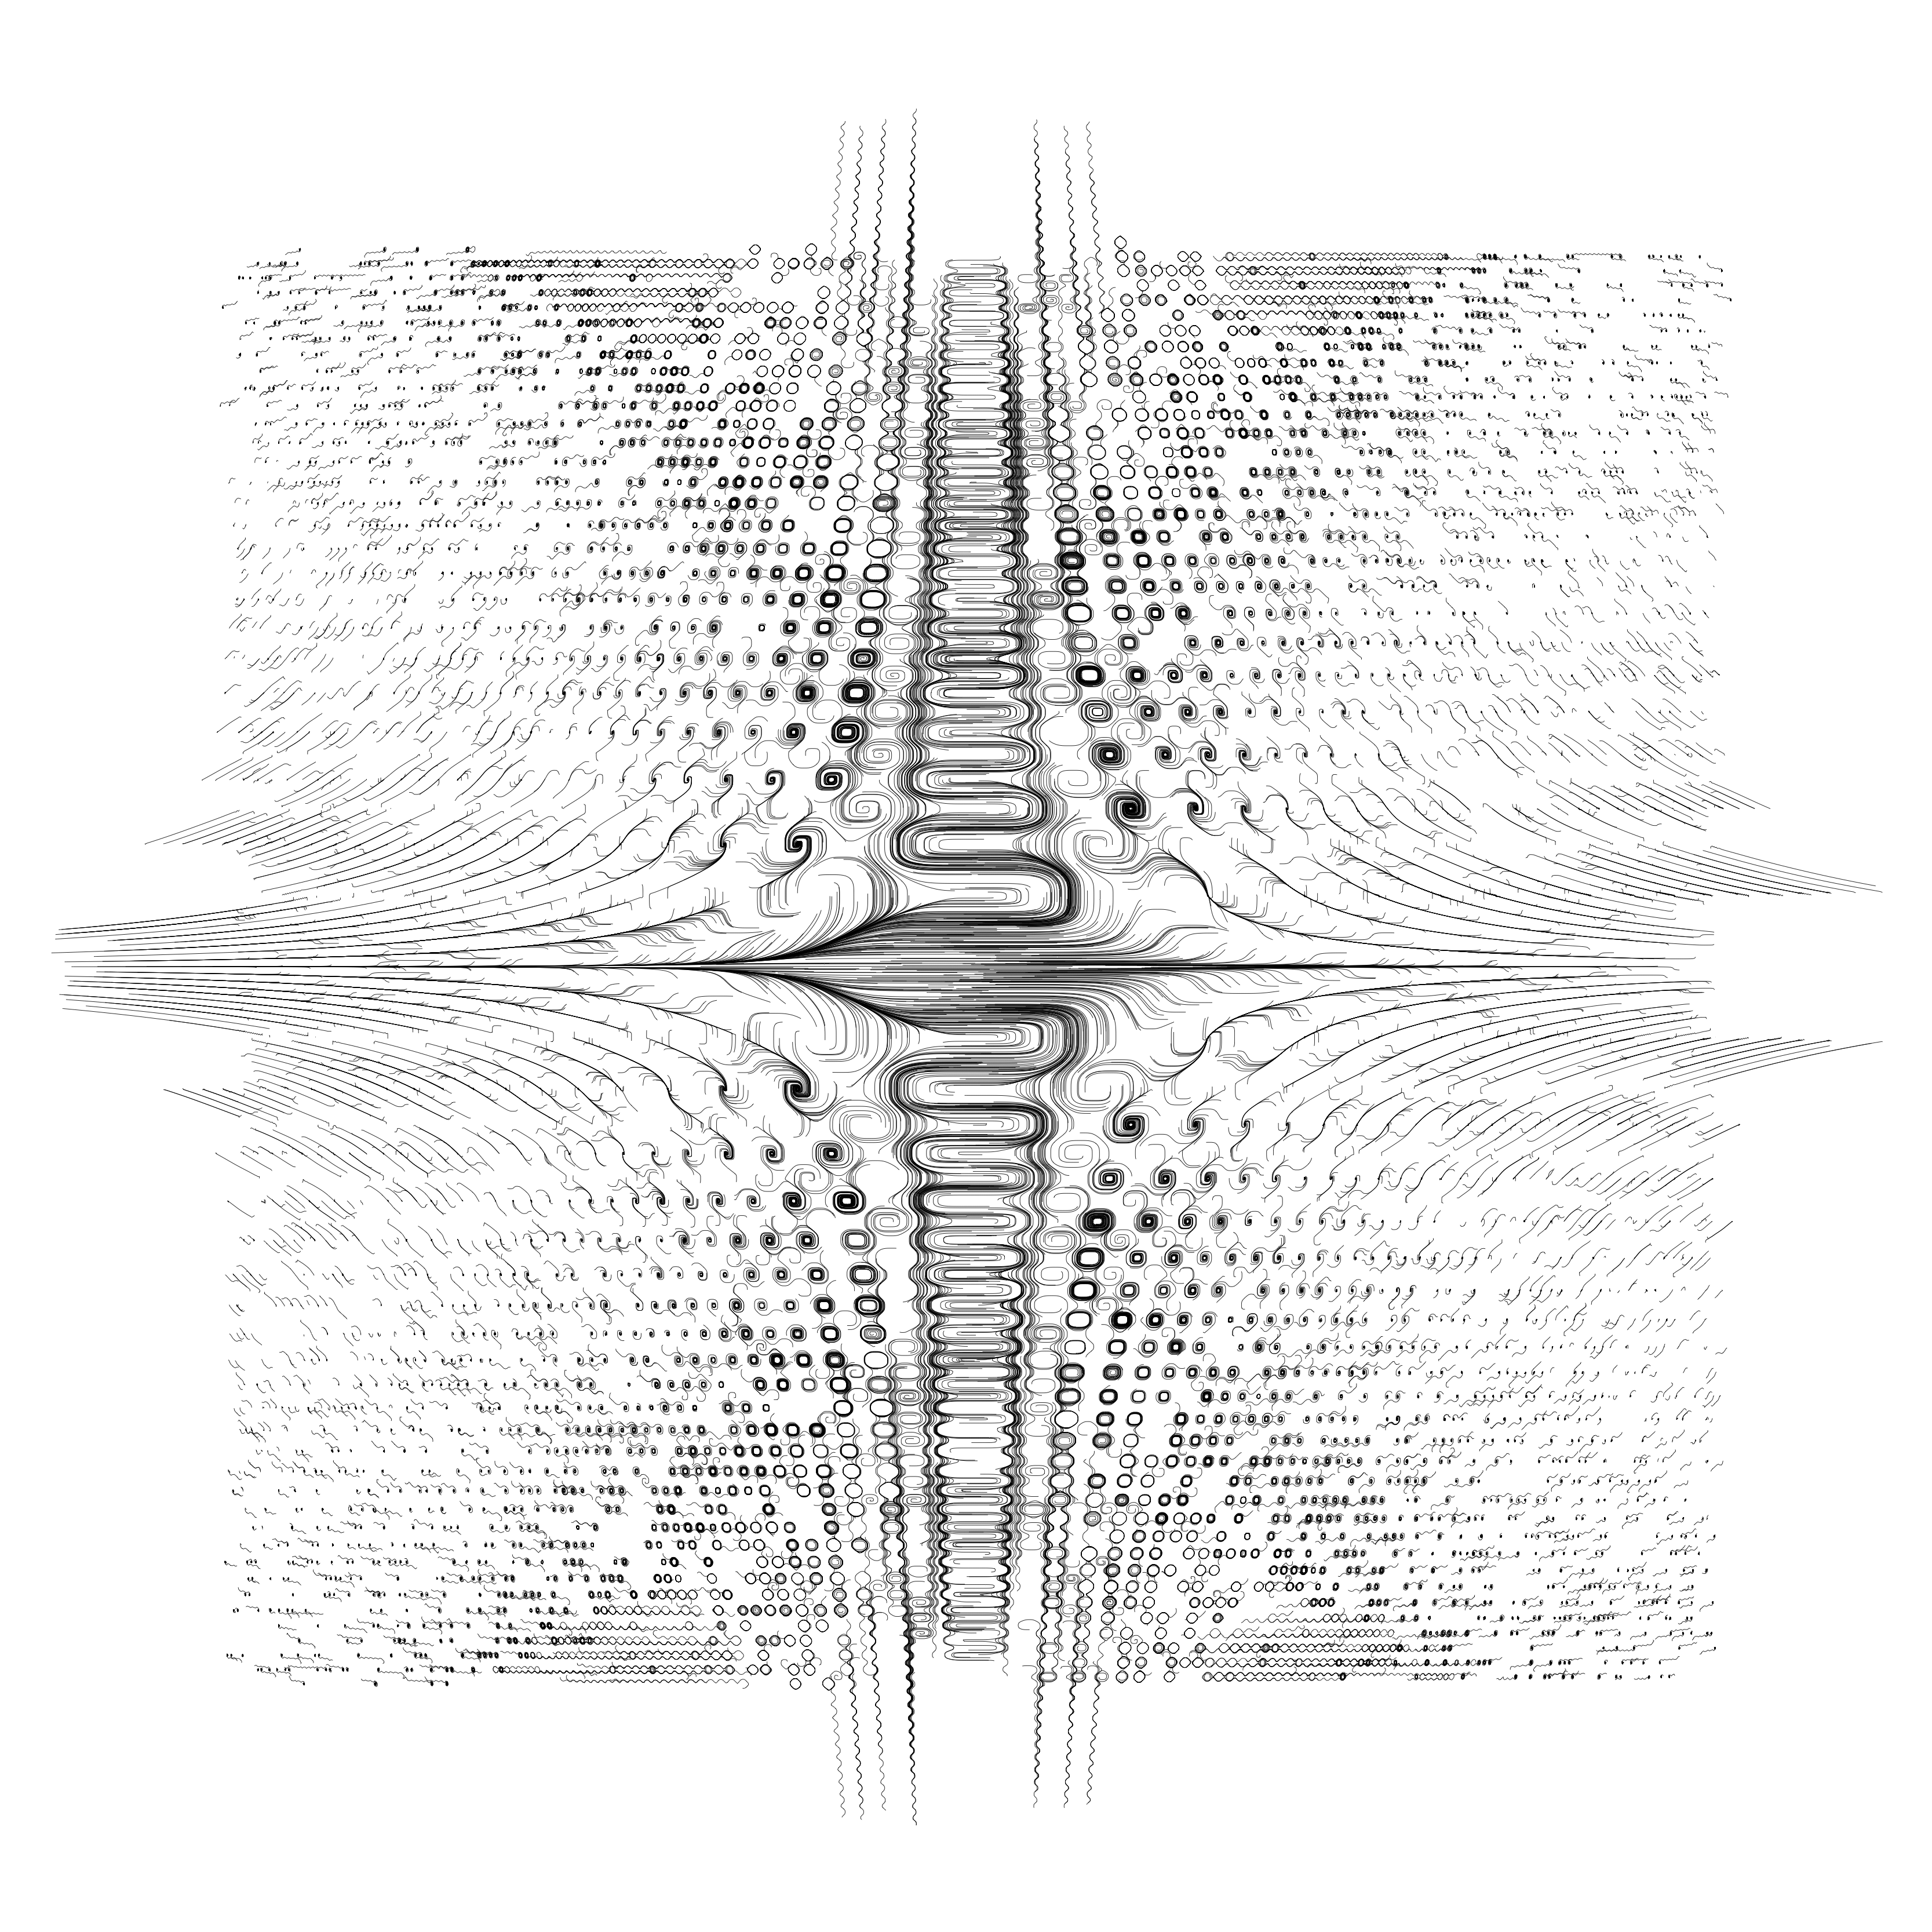
]Trajectories of particles moving across a vector flow field, starting from 10,000 points on the perimeter of the unit circle.
n = 10000;
m = 50;
s = 0.025;
c = {4.5, -1.2, 5.4, 9.1, -7.1, -0.9};

nextPoint = Function[xy,
 dx = c[[1]]*xy[[1]] + c[[2]]*Tan[c[[3]]*xy[[2]]];
 dy = c[[4]]*xy[[2]] + c[[5]]*Tan[c[[6]]*xy[[1]]];

 d = Sqrt[dx^2 + dy^2];

 xy + {dx, dy}*s/d
];

points = Table[
 NestList[
  nextPoint[#] &,
  {Cos[i/n*2*Pi], Sin[i/n*2*Pi]},
  m
 ],
 {i, 1, n}
];

ymax = Max[points];

ListLinePlot[
 points,
 AspectRatio -> 1,
 Axes -> False,
 ImagePadding -> 5,
 ImageSize -> {800, 800},
 PlotRange -> {{-ymax, ymax}, {-ymax, ymax}},
 PlotStyle -> Directive[{Black, Thickness[0.00006]}]
]Trajectories of particles moving across a vector flow field.
SeedRandom[865];
n = 10000;
m = 200;
s = 0.05;

nextPoint = Function[xy,
 dx = -(5*Sin[0.1*xy[[2]]*xy[[2]]*xy[[1]]])^3;
 dy = -(5*Cos[0.1*xy[[1]]*xy[[1]]*xy[[2]]])^3;

 d = Sqrt[dx^2 + dy^2];

 xy + {dy, dx}*s/d
];

points = Table[
 NestList[
  nextPoint[#] &,
  RandomReal[{-4, 4}, 2],
  m
 ],
 n
];

ListLinePlot[
 points,
 AspectRatio -> 1,
 Axes -> False,
 ImageSize -> {800, 800},
 PlotStyle -> Directive[{Black, Thickness[0.00006]}]
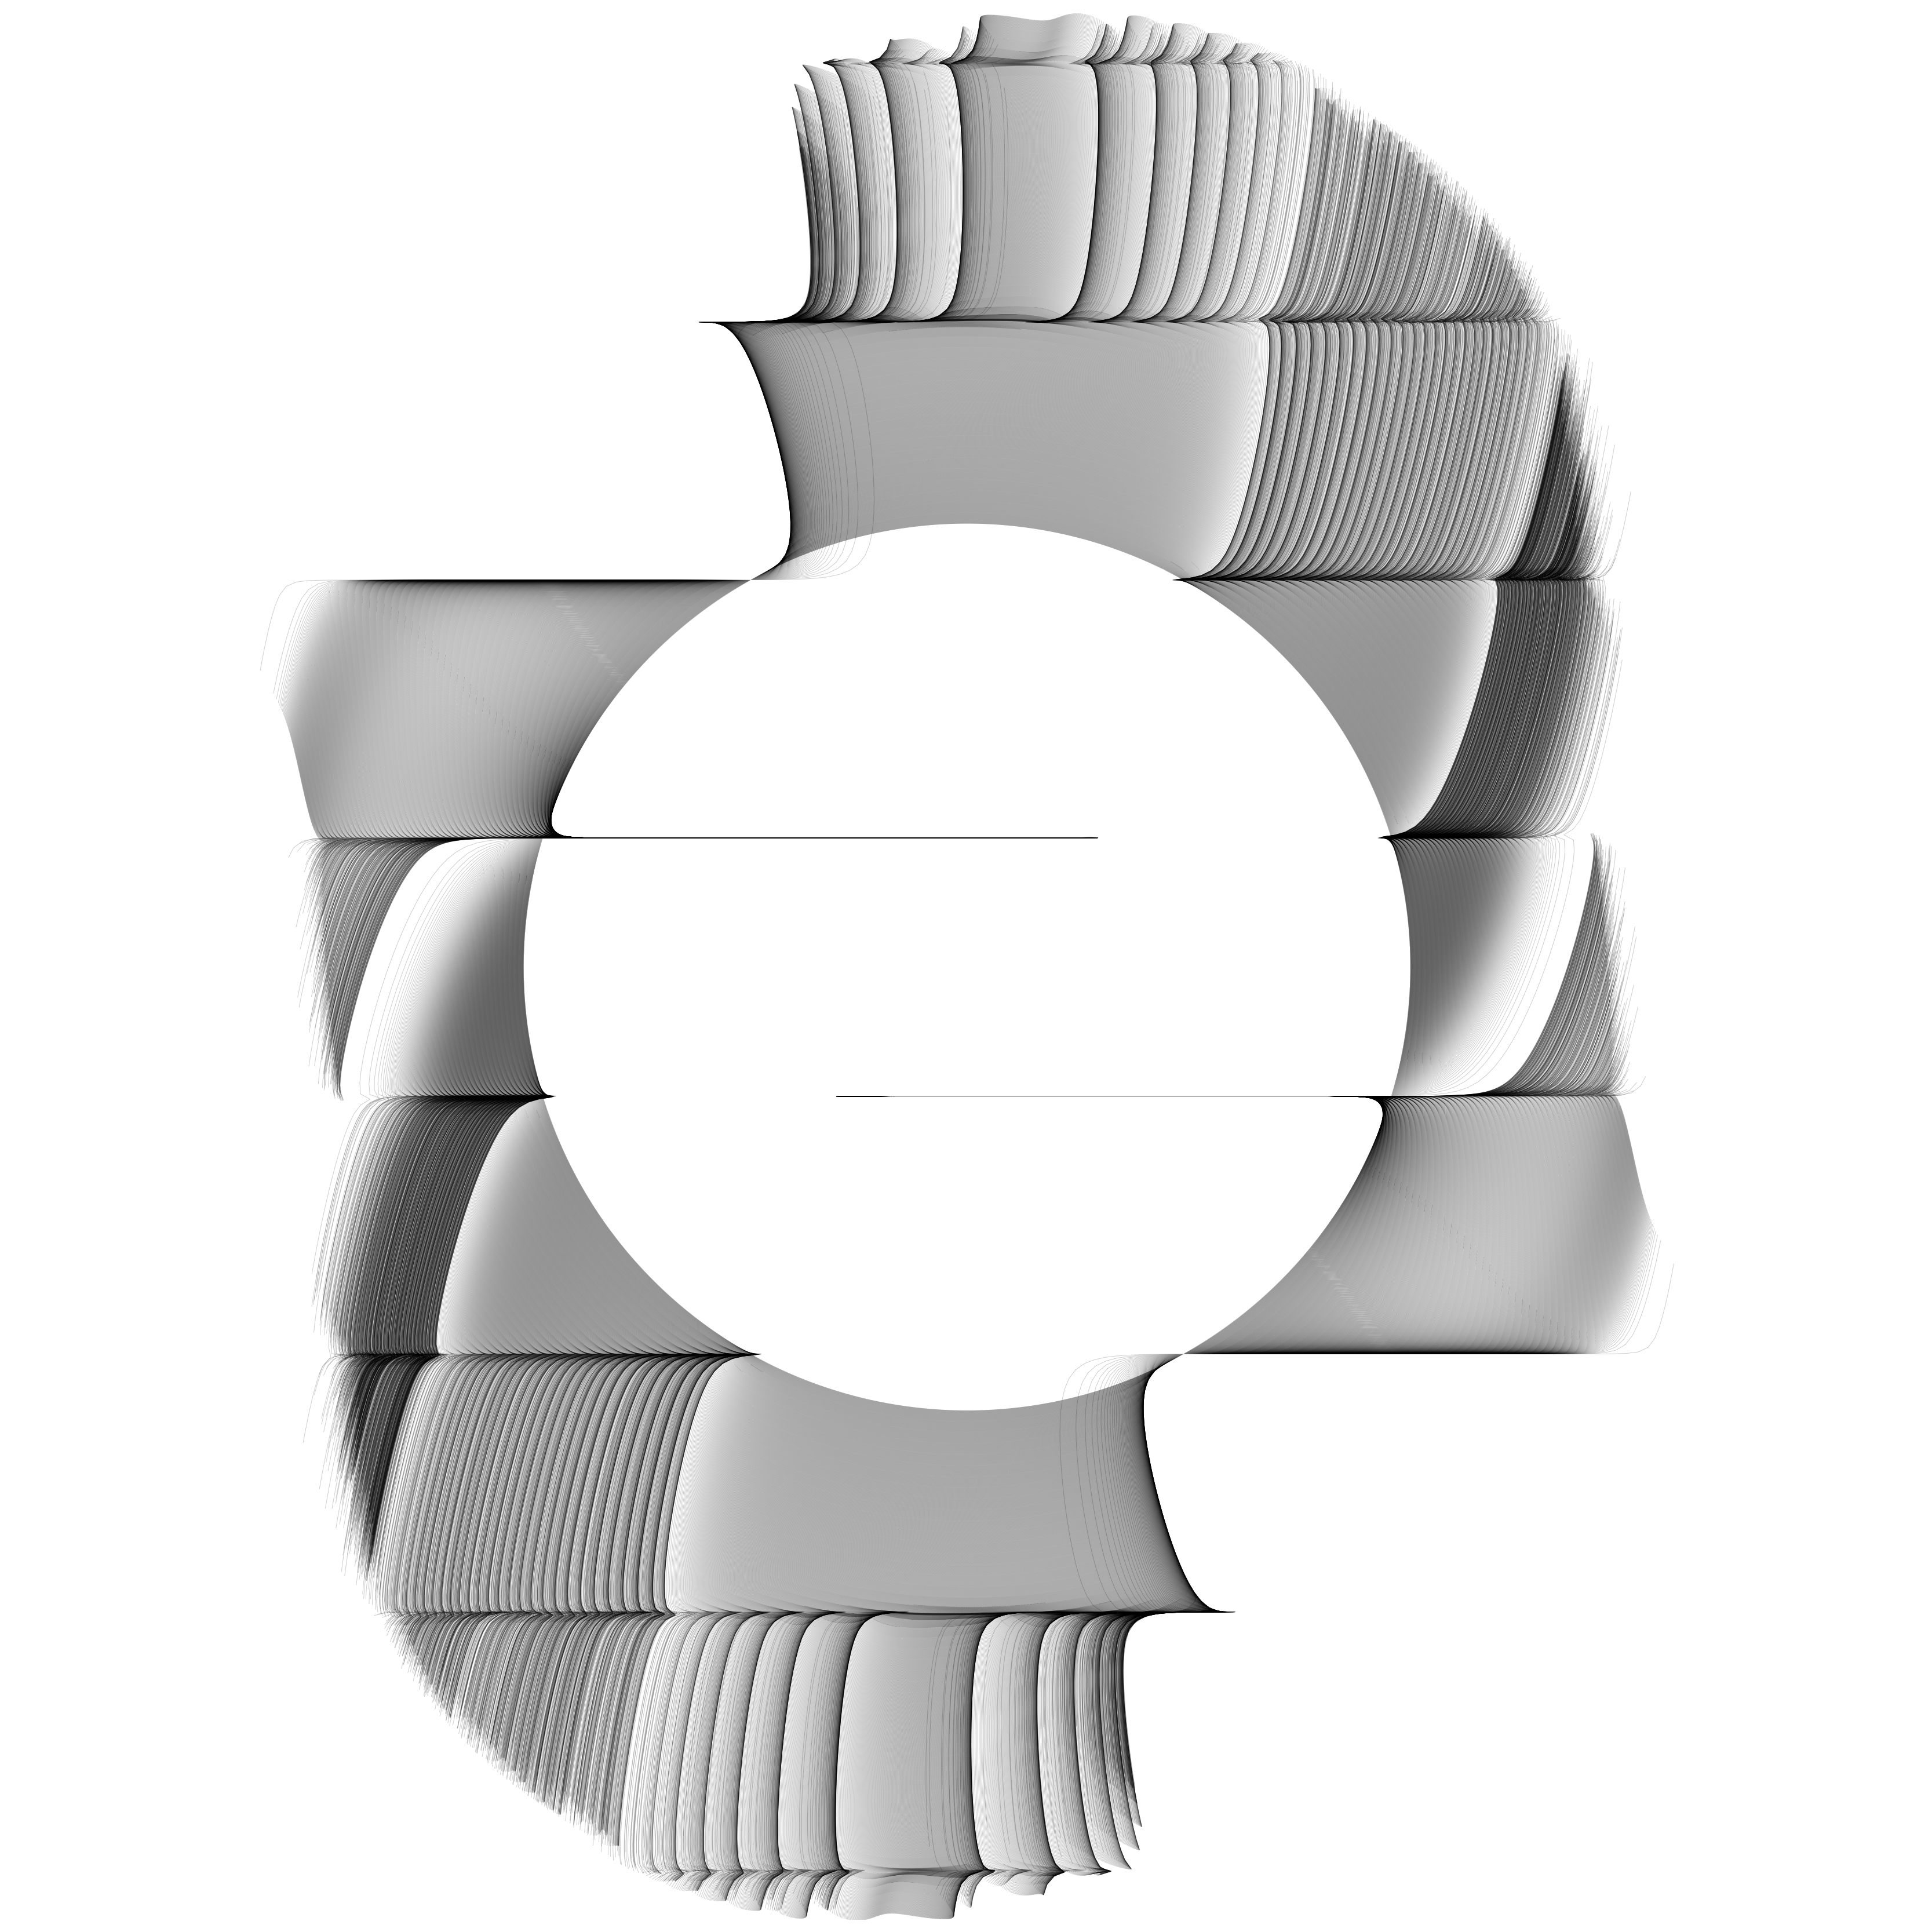
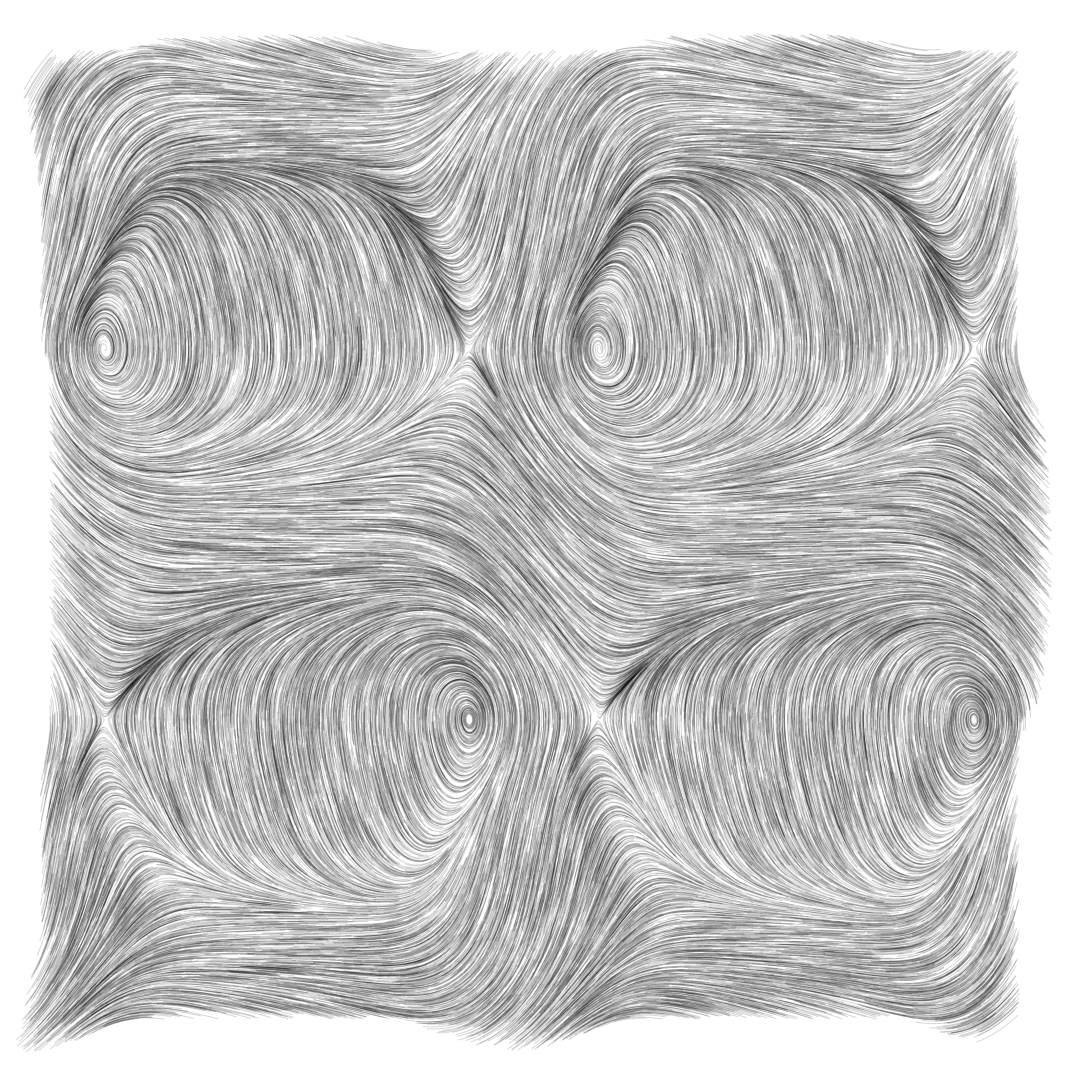
];Trajectories of particles moving across a vector flow field defined by equations with coefficients c and powers p.
SeedRandom[865];
n = 40000;
m = 50;
s = 0.001;
c = {3.3, 0.9, -0.8, -5.4, 5.3, -5.6, 3.7, 7.6, 5.0, 0.9, -6.1, -6.1};
p = {6, 2, 3, 2, 3, 6};

nextPoint = Function[xy,
 dx = c[[1]]*(Sin[c[[2]]*xy[[1]]])^(p[[1]]) +
      c[[3]]*(Sin[c[[4]]*xy[[2]]])^(p[[2]]) +
      c[[5]]*(Cos[c[[6]]*xy[[2]]])^(p[[3]]);

 dy = c[[7]]*(Sin[c[[8]]*xy[[2]]])^(p[[4]]) +
      c[[9]]*(Sin[c[[10]]*xy[[1]]])^(p[[5]]) +
      c[[11]]*(Cos[c[[12]]*xy[[1]]])^(p[[6]]);

 d = Sqrt[dx^2 + dy^2];

 xy + {dx, dy}*s/d
];

points = Table[
 NestList[
  nextPoint[#] &,
  RandomReal[{-0.5, 0.5}, 2],
  m
 ],
 n
];

ListLinePlot[
 points,
 AspectRatio -> 1,
 Axes -> False,
 ImageSize -> {800, 800},
 PlotStyle -> Directive[{Black, Thickness[0.00015]}],
 PlotRange -> {{-0.55, 0.55}, {-0.55, 0.55}}
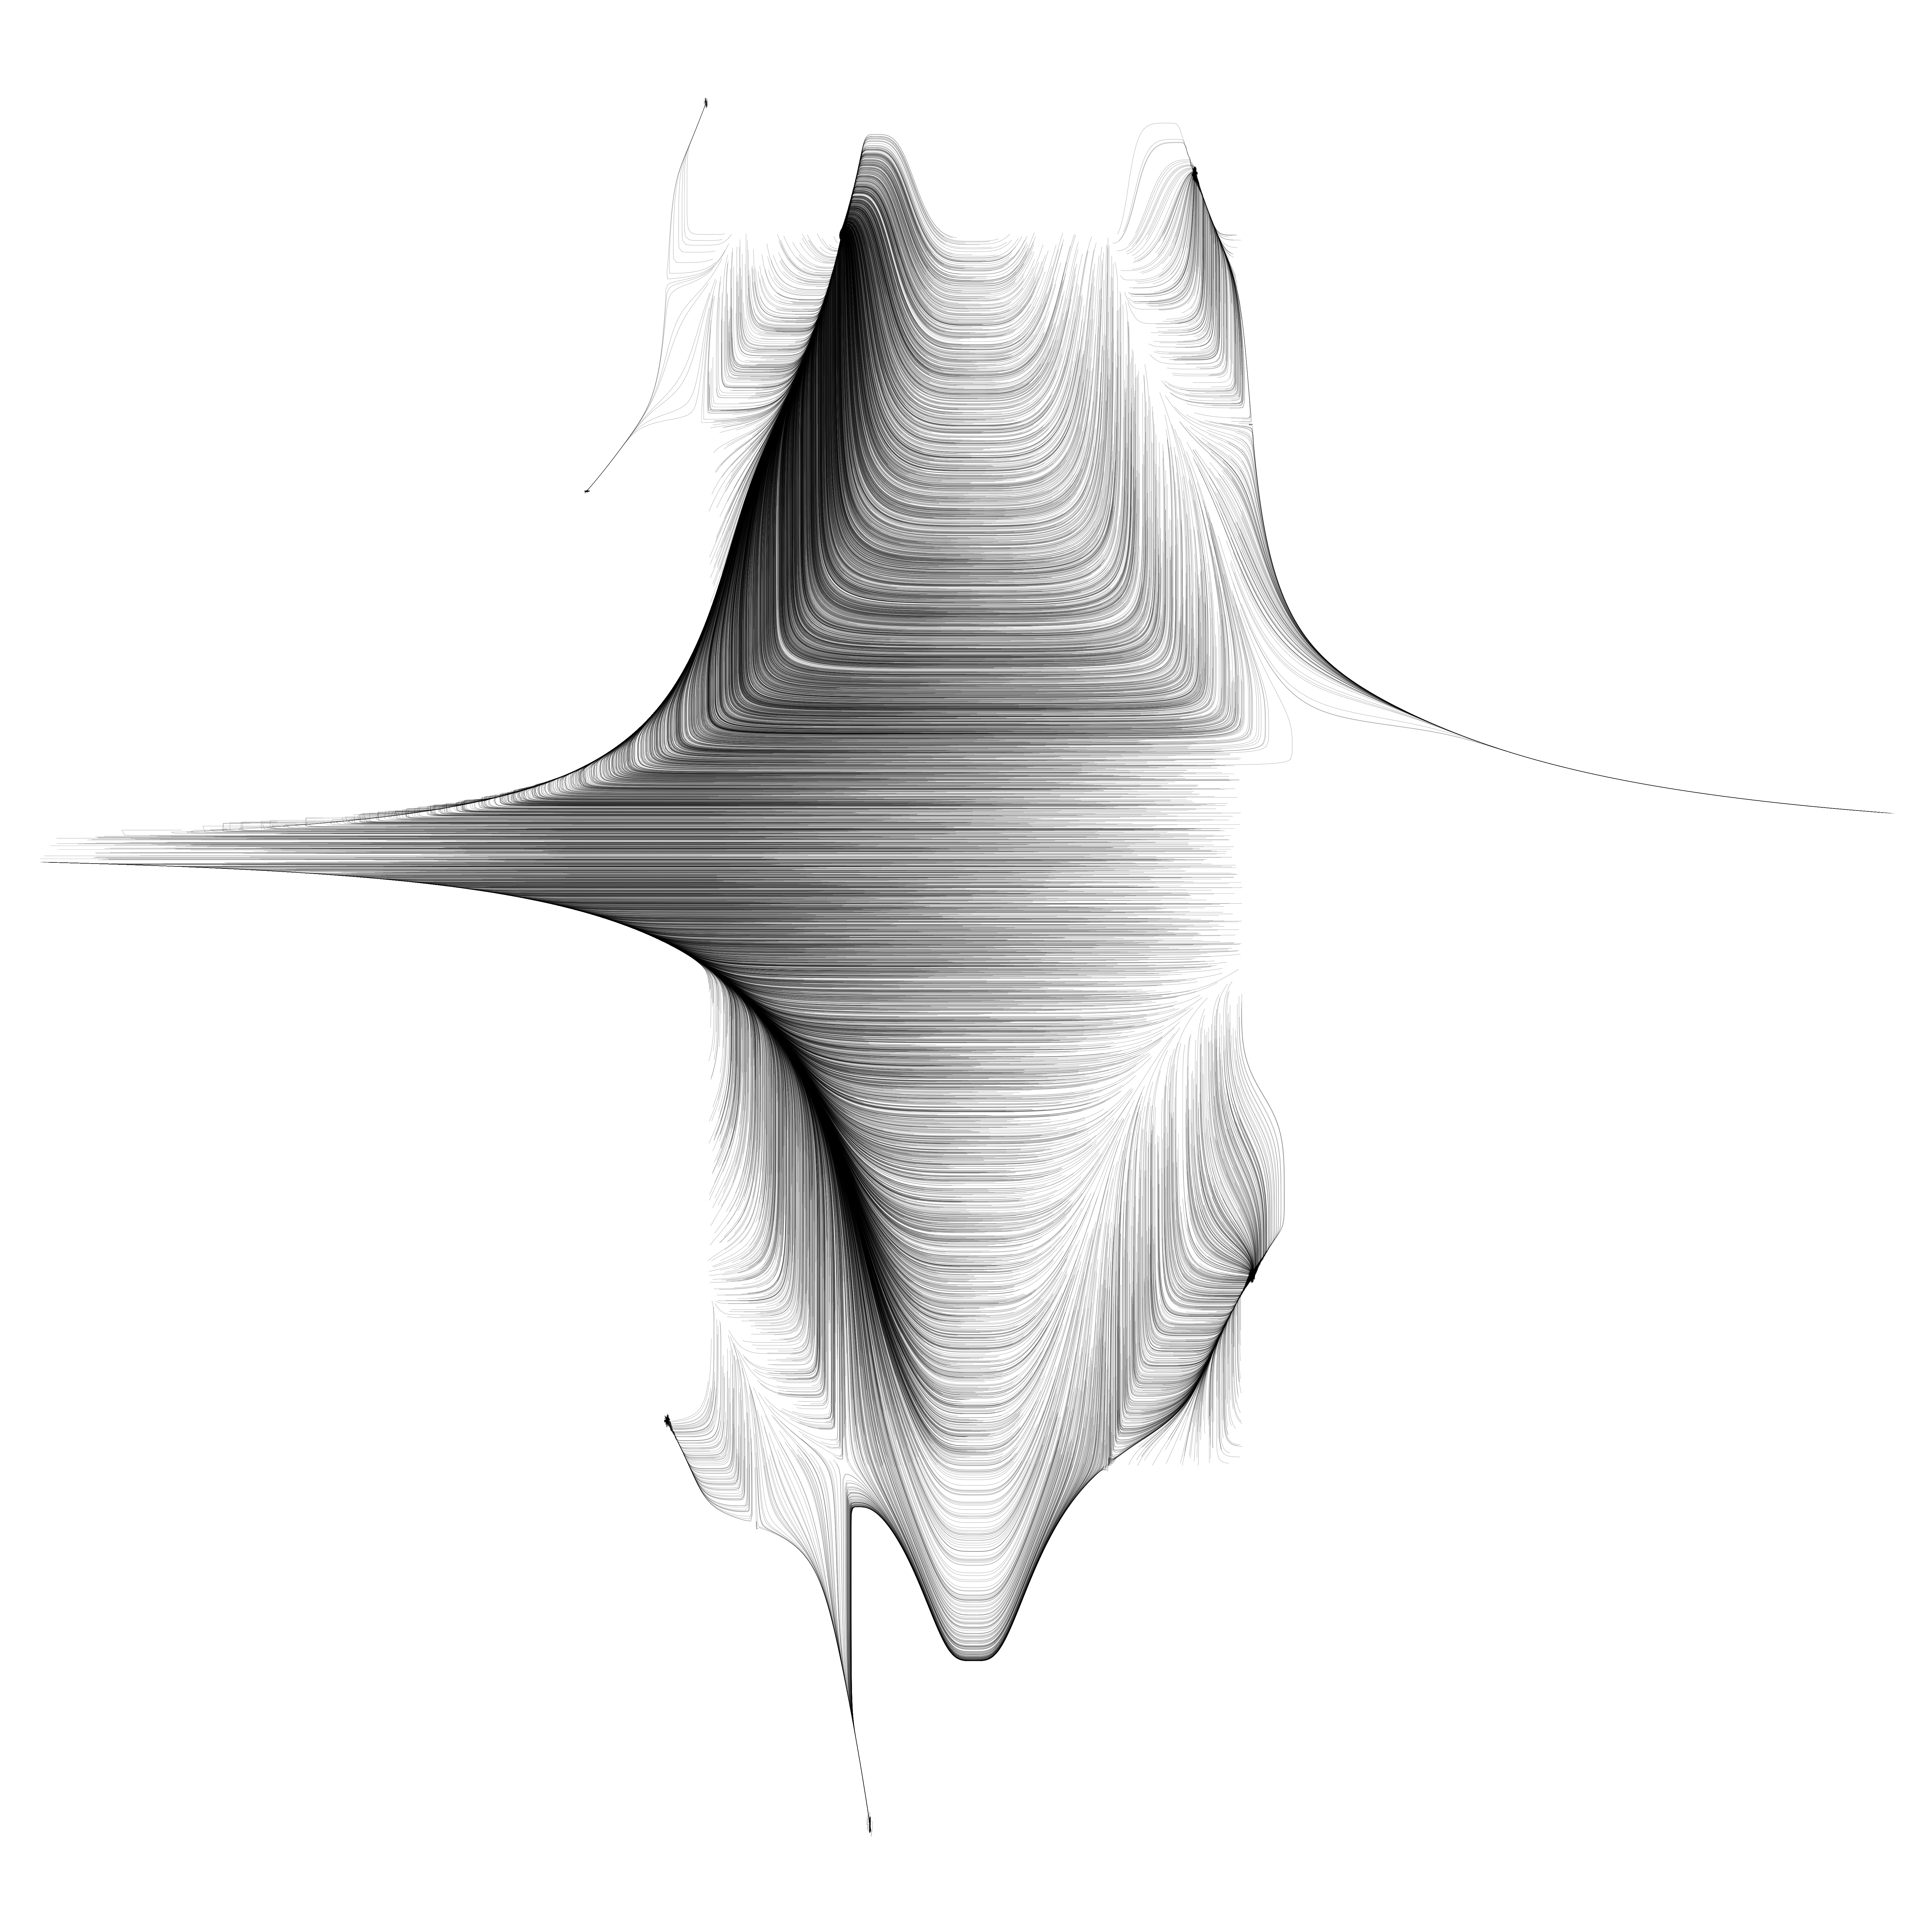
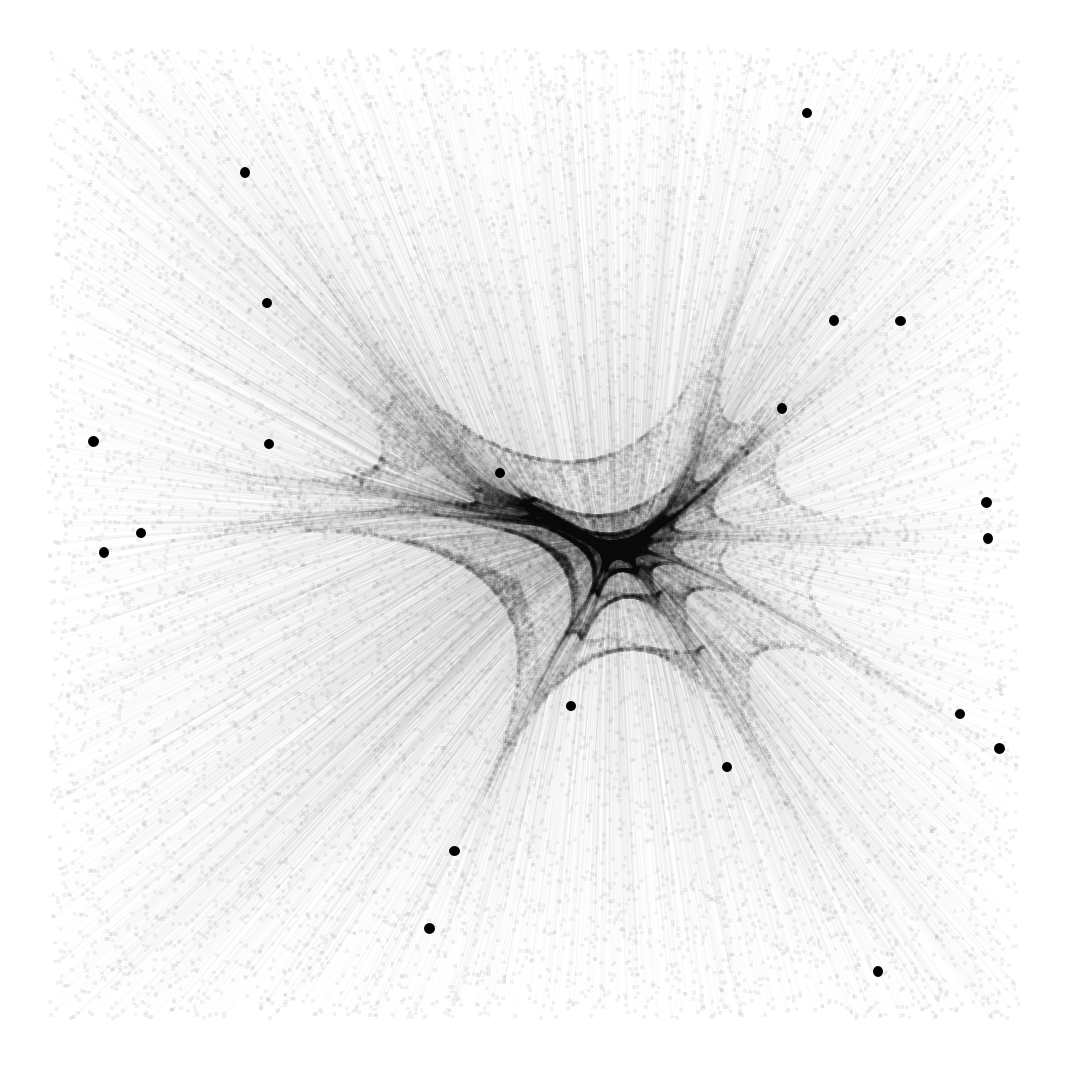
]Iterative paths converging to the geometric median of 20 terminals using Weiszfeld's algorithm, starting from 10,000 random initial locations.
SeedRandom[938463];

terminals = RandomReal[1, {20, 2}];

nextPoint = Function[{p, terminals},
 (#/EuclideanDistance[p, #] & /@ terminals // Total)/
 (1/EuclideanDistance[p, #] & /@ terminals // Total)
];

points = Table[
 NestWhileList[
  nextPoint[#, terminals] &,
  RandomReal[1, 2],
  EuclideanDistance[#1, #2] > 0.0001 &,
  2
 ],
 10000
];

Show[
 ListLinePlot[
  points,
  PlotMarkers -> {Style[\[FilledCircle], Black], Scaled[0.0001]},
  PlotStyle -> Directive[{Black, Opacity[0.05], Thickness[0.0003]}],
  PlotRange -> {{-0.05, 1.05}, {-0.05, 1.05}}
 ],
 ListPlot[
  terminals,
  PlotStyle -> {Black, PointSize[Large]},
  PlotRange -> {{-0.05, 1.05}, {-0.05, 1.05}}
 ],
 AspectRatio -> 1,
 Axes -> False,
 ImageSize -> {800, 800}
]