Easily create axes layouts for complex matplotlib figures.
- python >= 3.7.0
- matplotlib >= 3.4
This package allows easy and programmable creation of matplotlib figure layouts using the actual size and relative positioning of axes. This is useful for complex, multi-axes figures, especially those with non-grid arrangements.
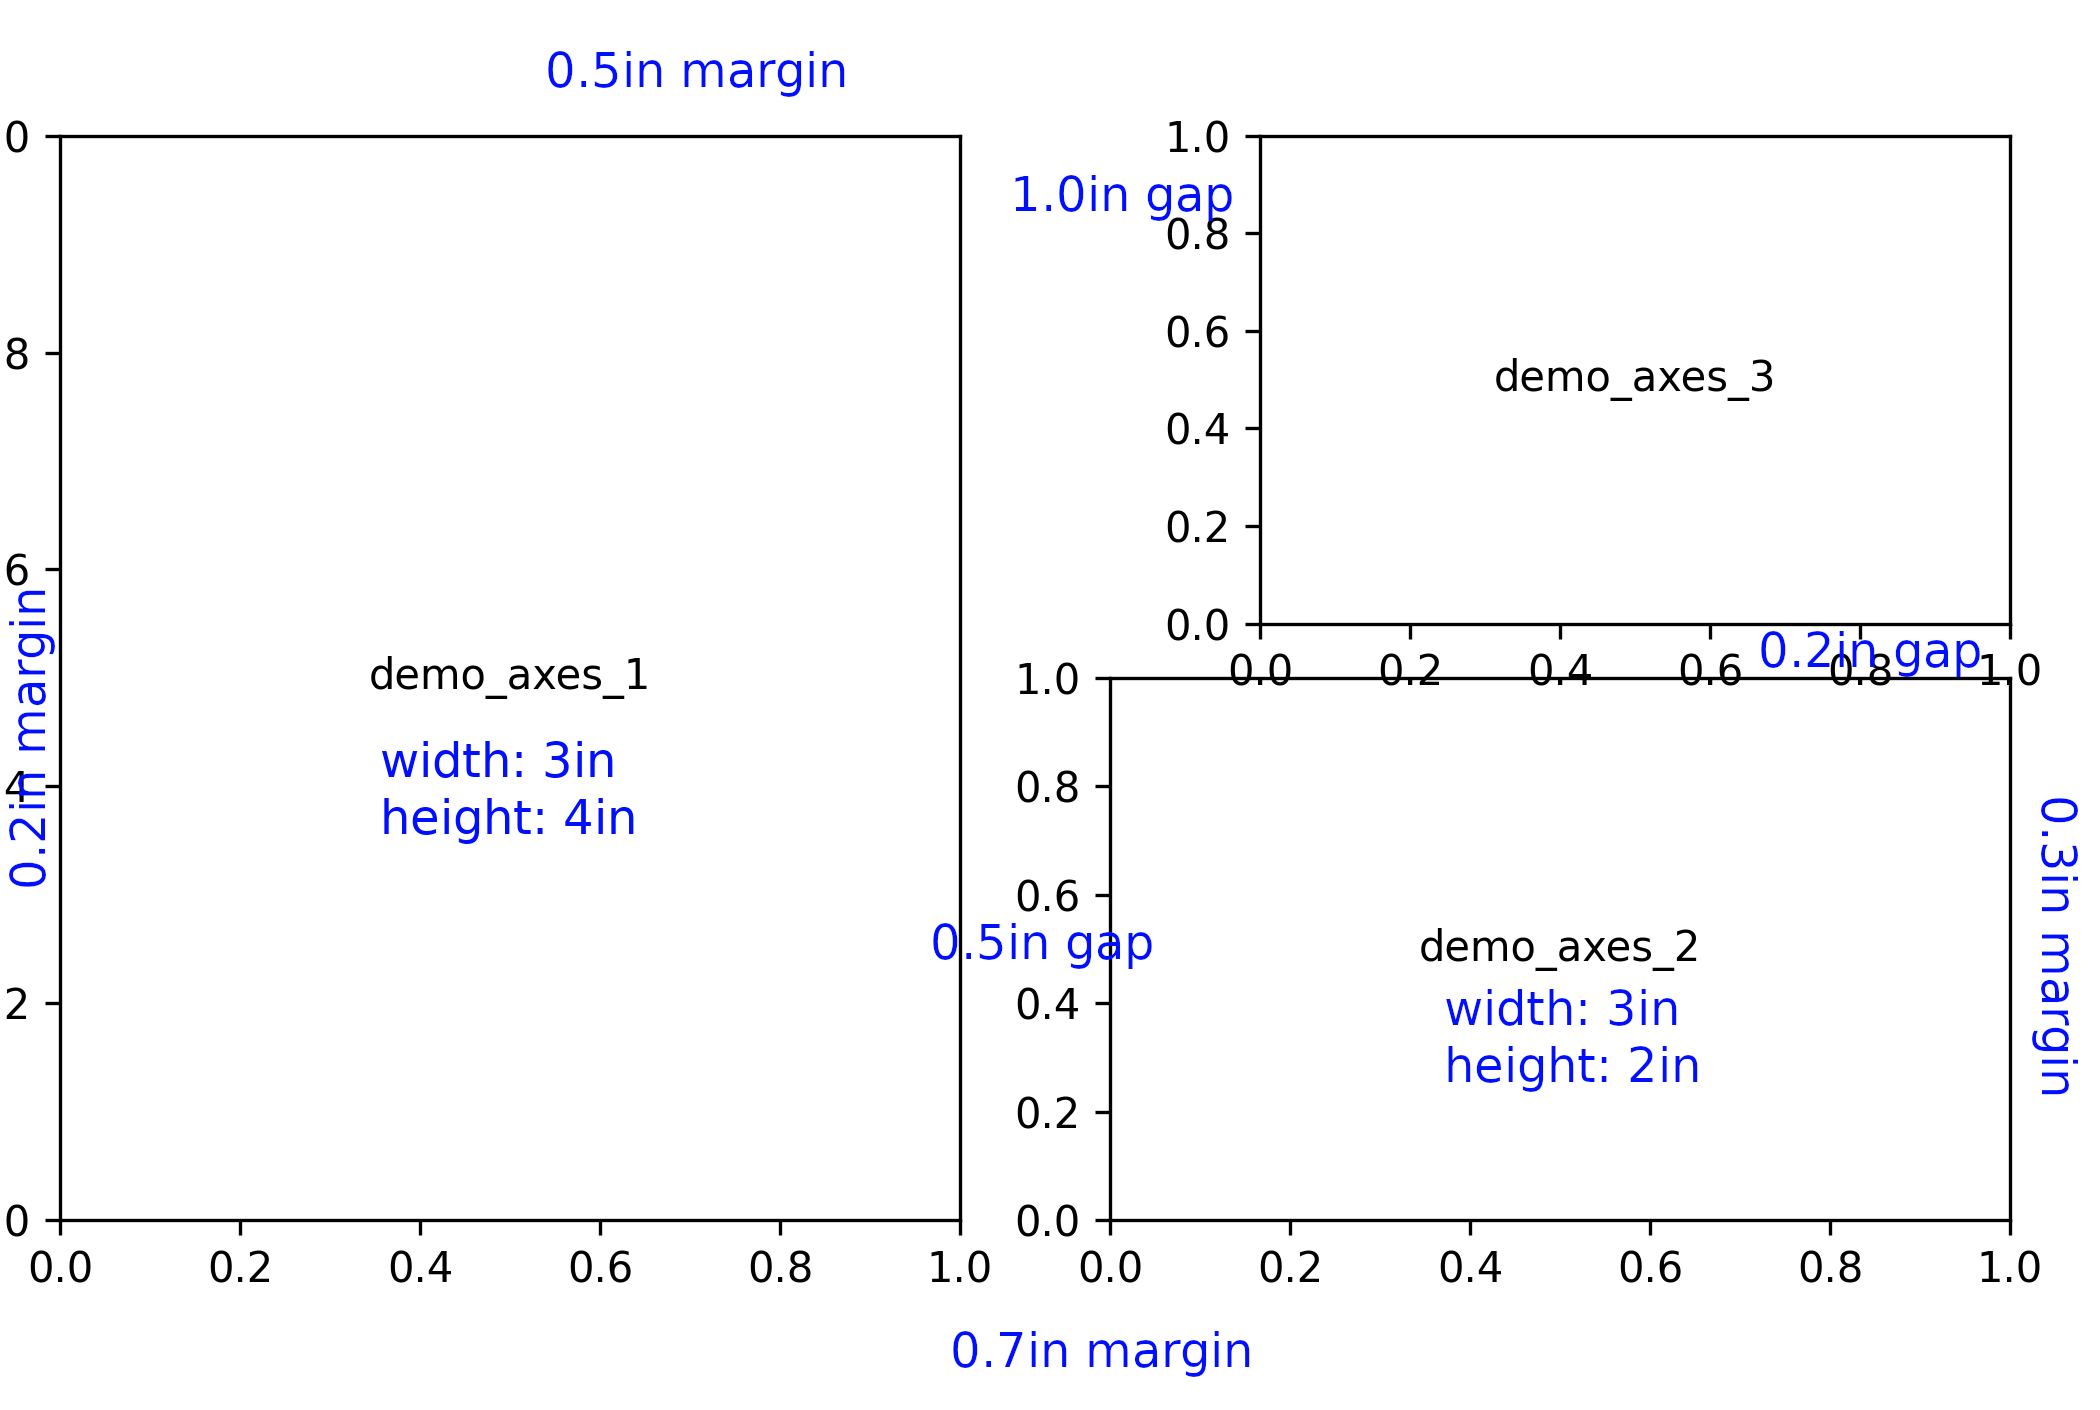
This piece of example tends to create a figure layout with below schematics:
import matplotlib
import matplotlib.pyplot
from mpllayout import LayoutCreator


lc = LayoutCreator(
	left_margin=0.2,  # padding inches to the left
	right_margin=0.3,  # padding inches to the right
	top_margin=0.5,  # padding inches on the top
	bottom_margin=0.7,  # padding inches at the bottom
)

# add the first axes (axes_1) to the layout, align axes_1's bottomleft corner
# to the figure's bottomleft corner (before adding margins)
axes_1 = lc.add_frame(
	"demo_axes_1",  # the key to retrieve matplotlib.axes.Axes objects later
)
axes_1.set_anchor("bottomleft")  # set the
axes_1.set_size(3, 4)  # in inches


# next, add a second axes (axes_2) to the layout, and position the axes_2's
# bottomleft 0.5 inches to the right of axes_1's bottomright corner
# then set the size of axes_2
axes_2 = lc.add_frame("demo_axes_2")
axes_2.set_anchor(
	"bottomleft",  # the anchor of axes_2 to set
	axes_1, "bottomright",  # the reference anchor of an already-existing axes
	offsets=(0.5, 0.0),  # x and y offsets in relative to the reference anchor
	# offsets are in inches
)
axes_2.set_size(3, 2)


# next, add a third axes (axes_3) to the layout, and position the axes_3's
# topleft corner 1.0 inches to the right of axes_1's topright corner, and its
# bottomright corner 0.2 inches above axes_2's topright corner.
#
# with both topleft and bottomright corners set, the size can be determined
# automatically. if size was manually sepcified but is different than the
# calculated size, an error will be raised
axes_3 = lc.add_frame("demo_axes_3")
axes_3.set_anchor("topleft", axes_1, "topright", offsets=(1.0, 0.0))
axes_3.set_anchor("bottomright", axes_2, "topright", offsets=(0, 0.2))


# create the layout
layout = lc.create_figure_layout()
figure = layout["figure"]  # figure is a reserved key referring to the
# matplotlib.figure.Figure object hosting all the axes


# now use matplotlib to draw something and show the figure
ax1 = layout["demo_axes_1"]  # retrieve the axes object using the previous key
ax1.text(0.5, 0.5, "demo_axes_1", transform=ax1.transAxes,
	ha="center", va="center")
ax2 = layout["demo_axes_2"]
ax2.text(0.5, 0.5, "demo_axes_2", transform=ax2.transAxes,
	ha="center", va="center")
ax3 = layout["demo_axes_3"]
ax3.text(0.5, 0.5, "demo_axes_3", transform=ax3.transAxes,
	ha="center", va="center")


# show the figure
matplotlib.pyplot.show()
This will generate a figure looks like below:

