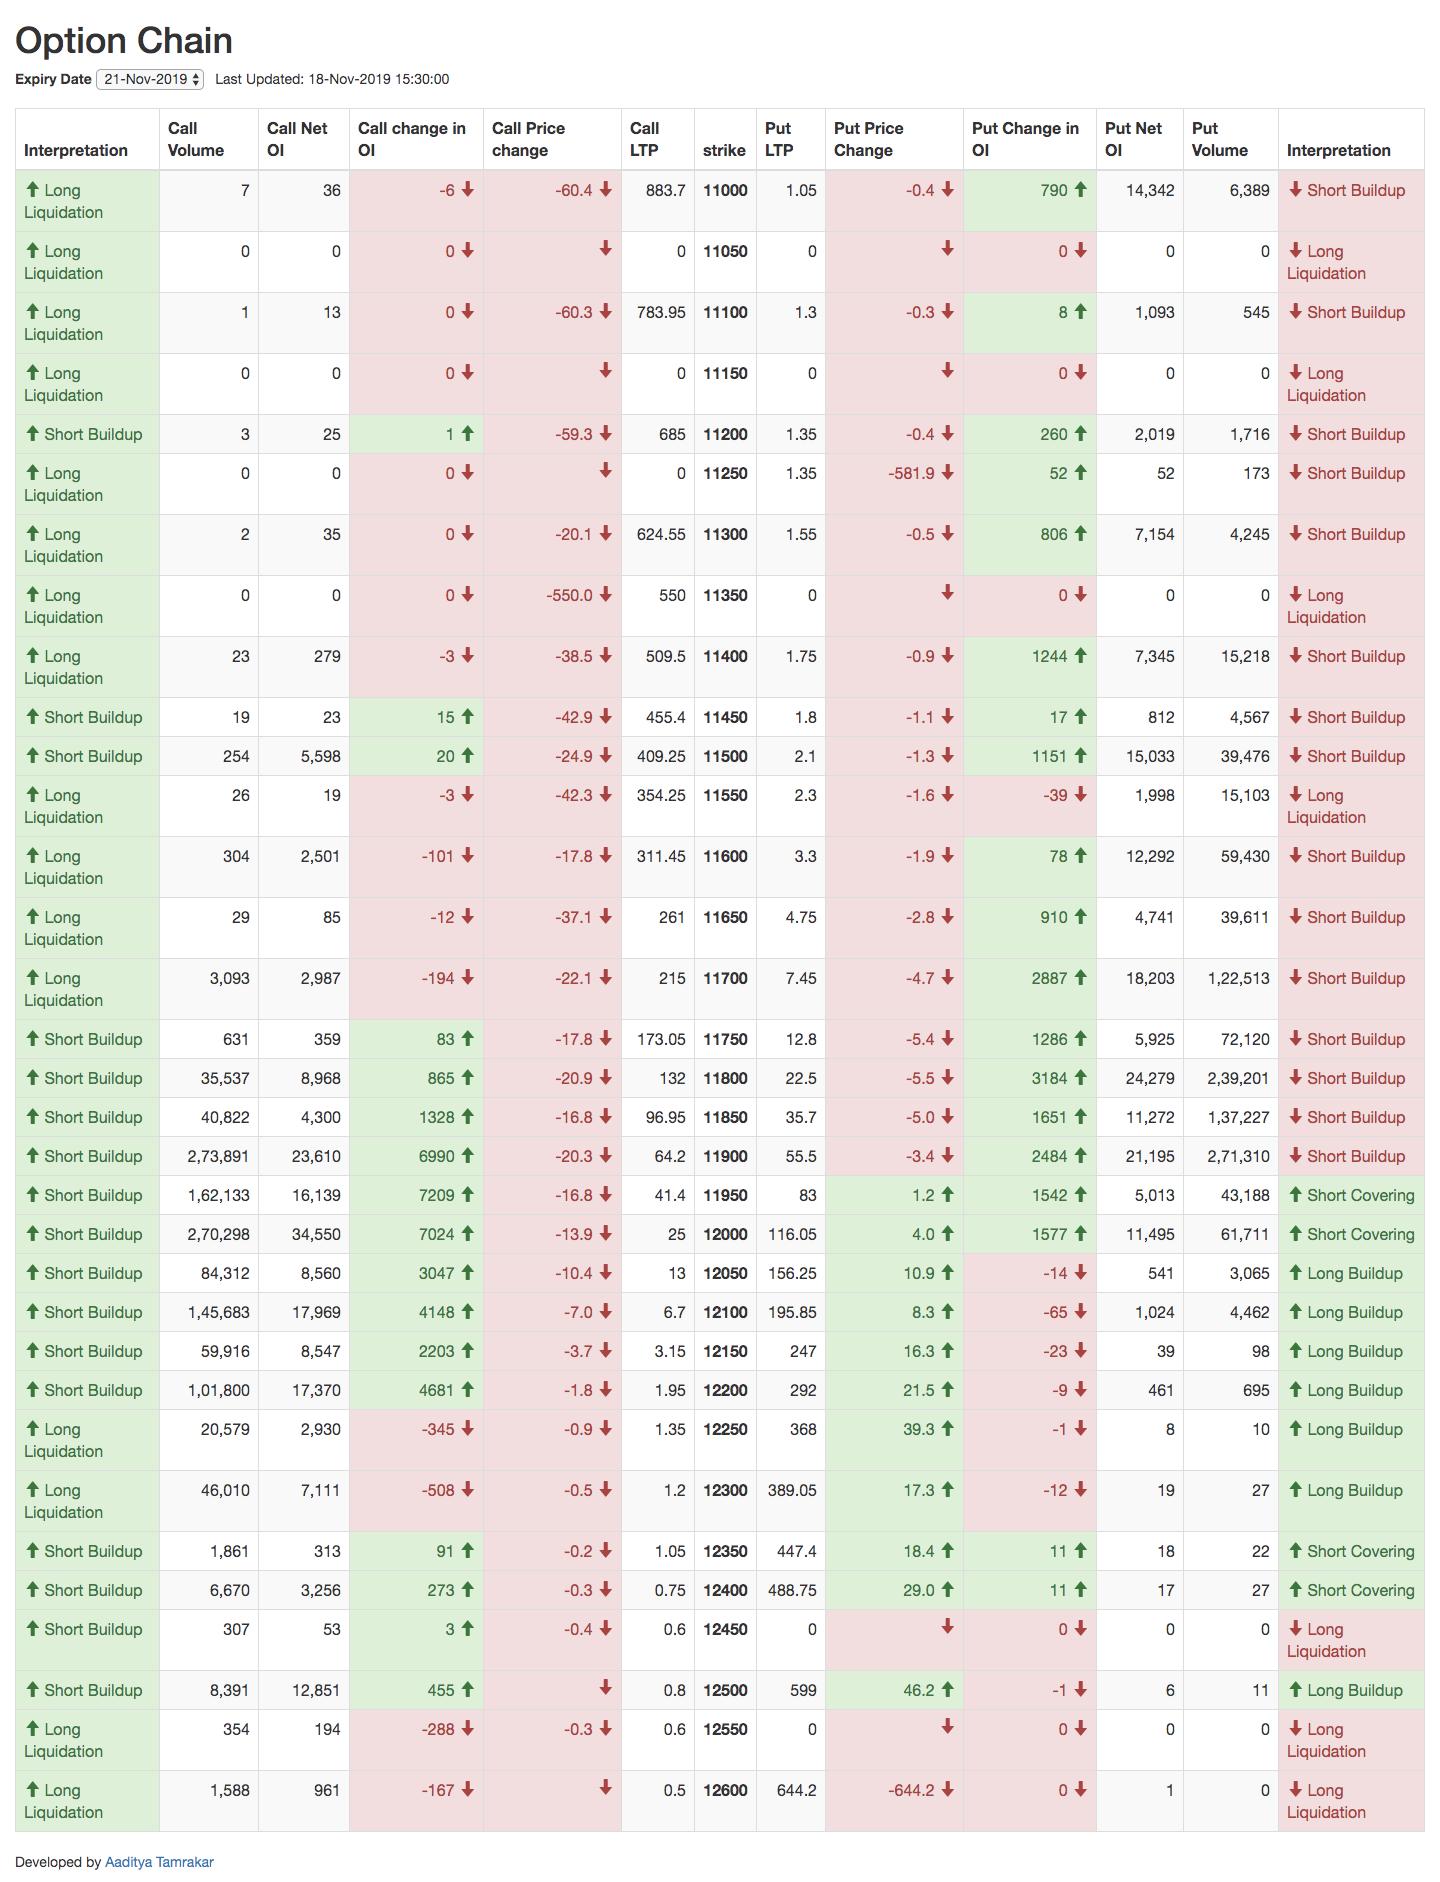
I wanted to quickly understand the market scenerio, so for I have developed this option chain analysis page. This page fetch data from official NSE website and analyse the option chain then displays the result. This project was developed for education purpose only, it has no commercial use.
You can also select expiry date, the data will be filtered and shown for that expiry only.
You can update app.js file. In place of NIFTY put FINNIFTY and it will show FINNIFTY Chain and analysis.
NSE India upgraded their API security. I have fixed the code in private repository. If your project is dependent on this library, I can give the code at cost.
The data is being fetched in realtime when a user visits the webpage via server. The data is accurate and unmodified version of NSE option chain. I have used CURL for scrapping option chain data which I found was working, NodeJs Request and Native HTTPs library was not working.
I have mentioned below the conditions, I have implemented in analysis of call options on the webpage.
Here, I am checking the price change and OI change and figuring out what is happening in the market.
| Price Change | OI Change | Option Analysis | TREND |
|---|---|---|---|
| Positive | Positive | Long Buildup | BULLISH |
| Negative | Positive | Short Buildup | BEARISH |
| Positive | Negative | Short Covering | BULLISH |
| Negative | Negative | Long Liquidation | BEARISH |
Below table can give action plan for particular trend.
| NIFTY TREND | CALL Option | PUT Option |
|---|---|---|
| BULLISH | BUY | SELL |
| BEARISH | SELL | BUY |
