-
Notifications
You must be signed in to change notification settings - Fork 394
New issue
Have a question about this project? Sign up for a free GitHub account to open an issue and contact its maintainers and the community.
By clicking “Sign up for GitHub”, you agree to our terms of service and privacy statement. We’ll occasionally send you account related emails.
Already on GitHub? Sign in to your account
Added Studio docs #2455
Added Studio docs #2455
Changes from 30 commits
76acd79
d8dc64b
a4e1813
54a6b21
a7665b4
aff29ea
0cb54e8
9ffd9af
4462653
6ec82c3
49e66fe
82550d1
15f1b71
9865910
b241ae8
5d7b96b
782a384
7774313
30af001
5284553
83e223a
23369fa
5c39c9d
756347c
ce22026
7eb44e3
1b14980
4ba41b1
997f022
0640323
6a96e64
8d14bc3
2fb4a5d
File filter
Filter by extension
Conversations
Jump to
Diff view
Diff view
There are no files selected for viewing
| Original file line number | Diff line number | Diff line change |
|---|---|---|
| @@ -0,0 +1,67 @@ | ||
| # Create a View | ||
|
|
||
| To create a new view for your repository, follow these steps. | ||
|
|
||
| 1. Sign into your [DVC Studio](https://studio.iterative.ai/) dashboard. | ||
| 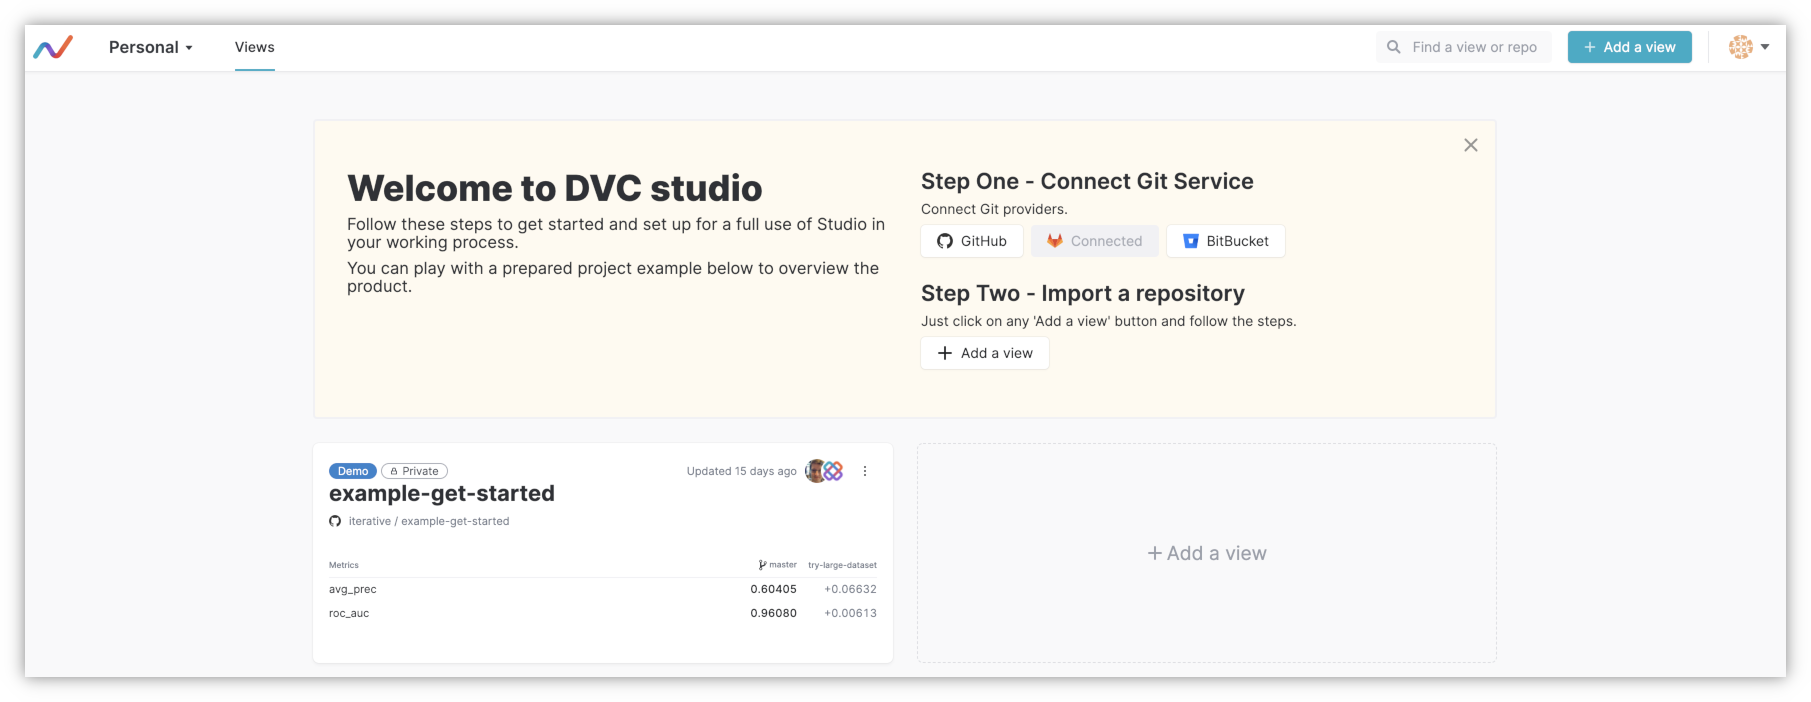 | ||
|
|
||
| 2. Click on `Add a View`. All the organizations that you have access to will be | ||
| listed. 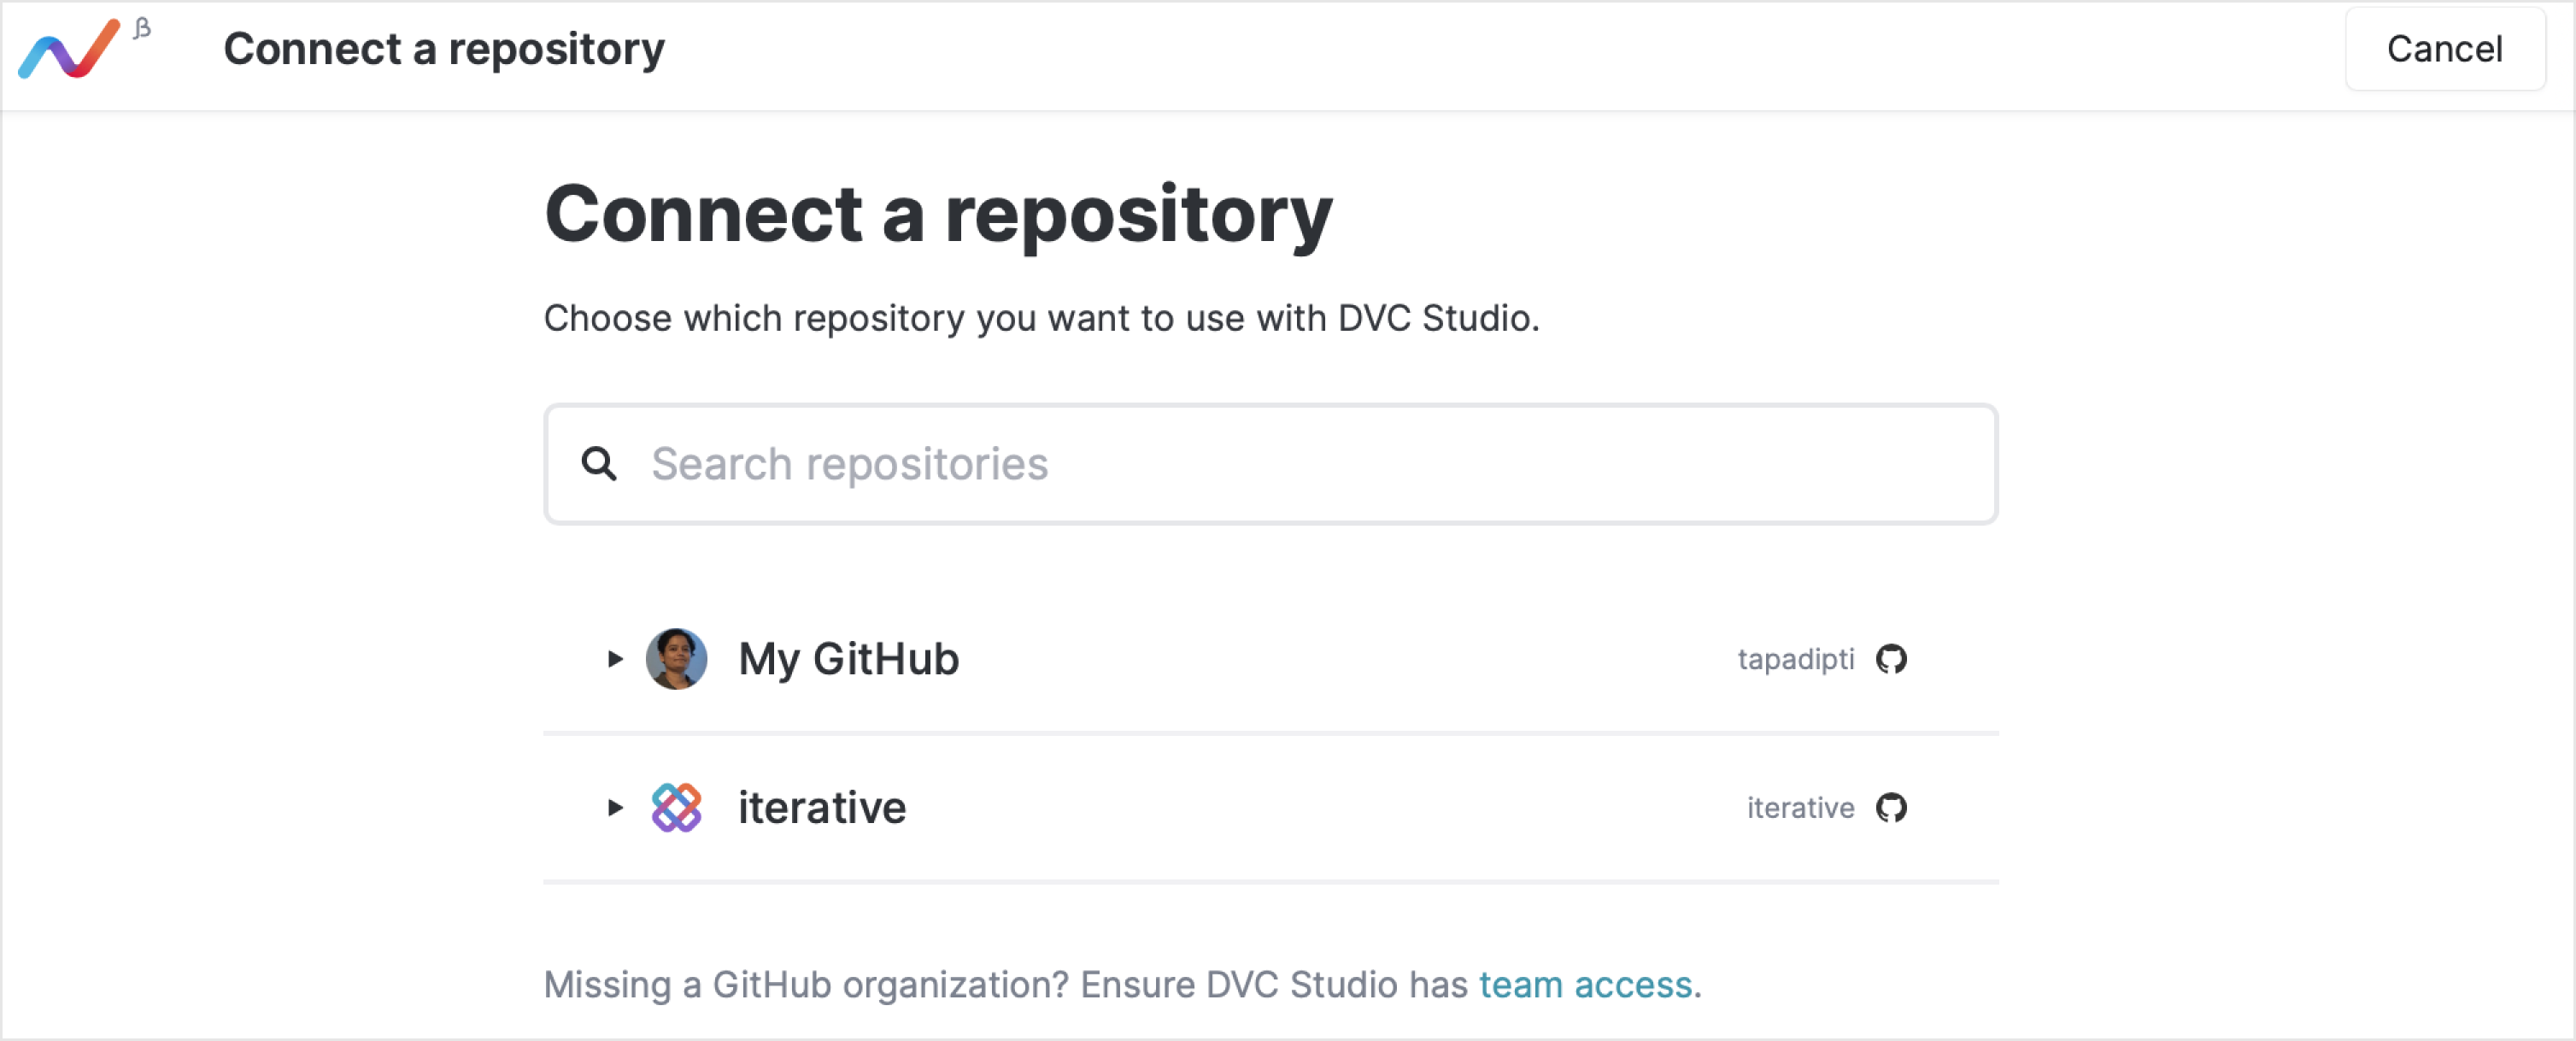 | ||
|
|
||
| 3. Open the organization whose repository you want to connect to. You can also | ||
| use the search bar to search directly for the repo which you want to connect | ||
| to. 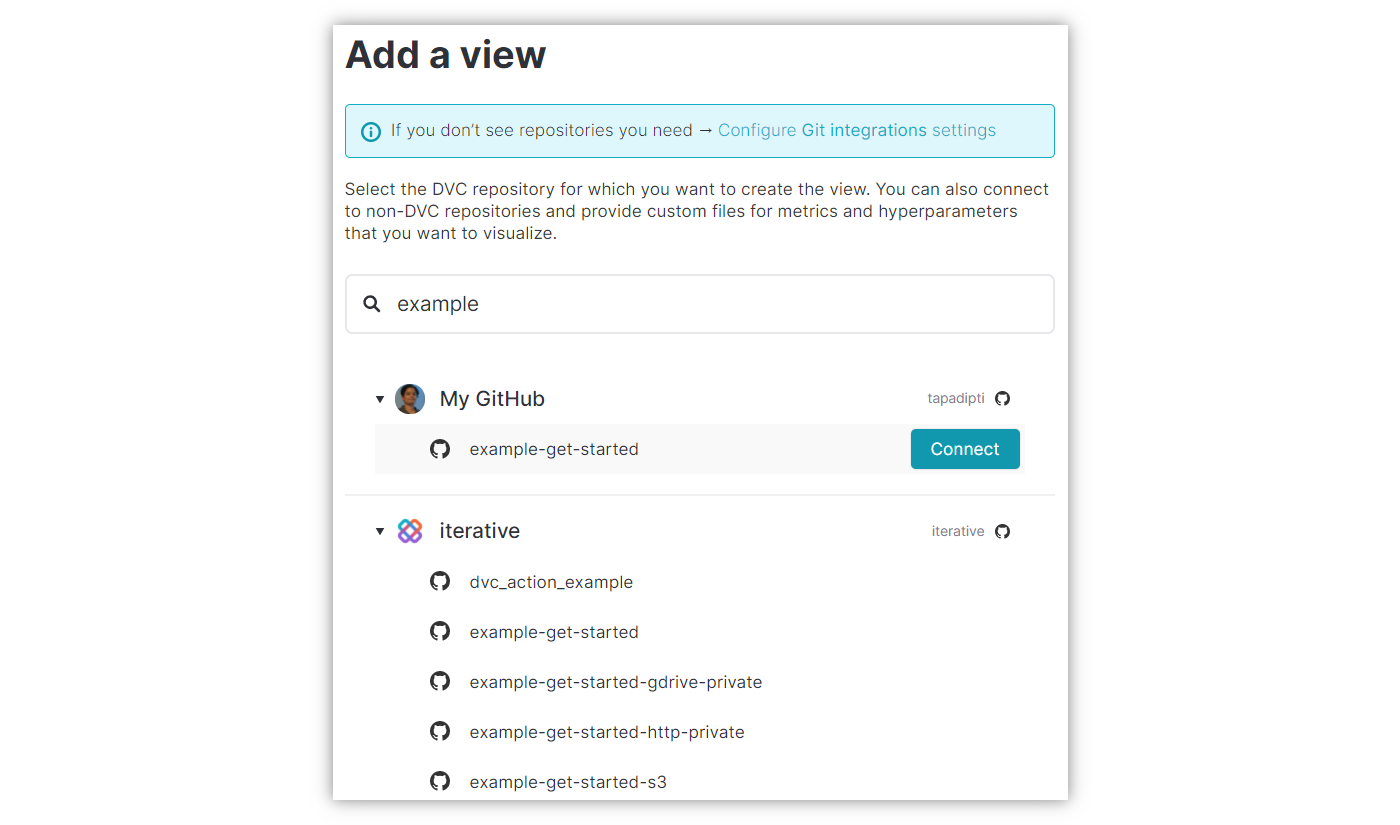 | ||
|
|
||
| 4. Select the Git repository for which you want to create a view. For this, | ||
| hover over the required repository and click on `Connect`. | ||
|
|
||
| 5. Once you click on `Connect`, you will be able to specify advanced settings | ||
| for the connection. | ||
| 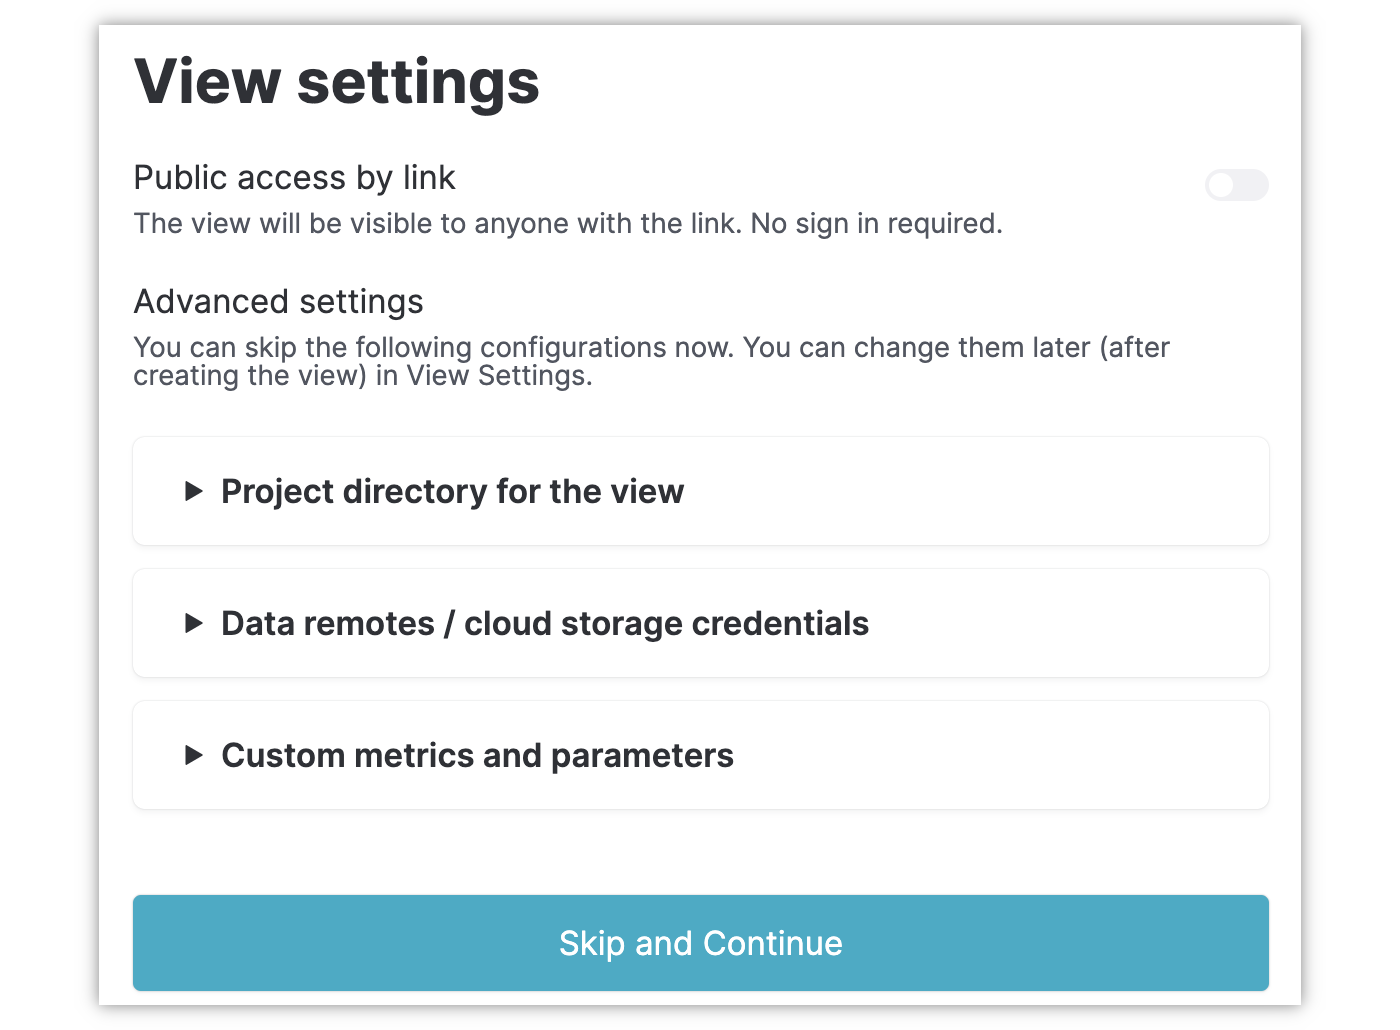 | ||
|
|
||
| > In most scenarios, you can skip the advanced settings. Refer to the | ||
| > [Advanced Settings](#advanced-settings) section below for more details. | ||
|
|
||
| You should now see that a view has been added in your dashboard. | ||
|
|
||
|  | ||
|
|
||
| If your project requires any of the advanced settings, then remember to | ||
| configure them by opening the View settings. Otherwise, your view may not work | ||
| as expected. To go to View settings, click on the | ||
|  icon in | ||
| the view. In the menu that opens up (highlighted in yellow in the screenshot | ||
| below), click on `Settings`. | ||
|
|
||
|  | ||
|
|
||
| ## Advanced Settings | ||
|
|
||
| You will need to specify advanced settings in the following scenarios. | ||
|
|
||
| > These settings can be skipped when creating the view -- they can be edited | ||
| > later. | ||
|
|
||
| - **Monorepo:** If you have connected to a | ||
| [monorepo](https://en.wikipedia.org/wiki/Monorepo), then specify the full path | ||
| to the root directory for the project that you want to connect to. | ||
|
|
||
| - **Data remotes:** The metrics and parameters that you want to include in the | ||
| view may be present in a data remote (cloud storage or another location | ||
| outside of the Git repo). If you want to include such data in your views, then | ||
| you will have to grant DVC Studio access to the data remote. | ||
|
|
||
| - **Custom metrics and parameters:** DVC Studio automatically detects metrics, | ||
| plots, and parameters files specified in the project's `dvc.yaml`. If you want | ||
| to connect custom files, you can add them by clicking on the `Add file` | ||
| button. Enter the full file path, and specify whether the file is for | ||
| `Metrics` or `Parameters`. | ||
|
|
||
| ## Share a view | ||
|
|
||
| You can share your views on the web. Simply click on the button labelled | ||
| `Private` next to the name of the view. In the menu that pops up, turn on | ||
| `Share to Web`.  | ||
|
|
||
| You can change a shared (public) view and make it private by turning off | ||
| `Share to web`. |
| Original file line number | Diff line number | Diff line change |
|---|---|---|
| @@ -0,0 +1,64 @@ | ||
| # Get Started with DVC Studio | ||
|
|
||
| Here, we will walk you through a tutorial to use DVC Studio for collaboration on | ||
| your ML projects. You will need access to a Github, Gitlab or Bitbucket account | ||
| which has access to the Git repositories you want to connect to from DVC Studio. | ||
| DVC Studio creates views from repositories when you connect to them. | ||
|
|
||
| ## What is a view? | ||
|
|
||
| A _view_ is an interactive representation of the experiments run in your ML | ||
| project. DVC Studio automatically identifies datasets, metrics and | ||
| hyperparameters in your ML experiments. You can also add custom files with the | ||
| required data (more on this later). Using this data, DVC Studio creates a | ||
| summary view. This includes tables of all the metrics across all your | ||
| experiments. You can also generate plots and compare experiments here. | ||
|
|
||
| ## DVC Studio Views page | ||
|
|
||
| In your browser, open <https://studio.iterative.ai>. Sign in with your Github, | ||
| Gitlab, or Bitbucket account. | ||
|
|
||
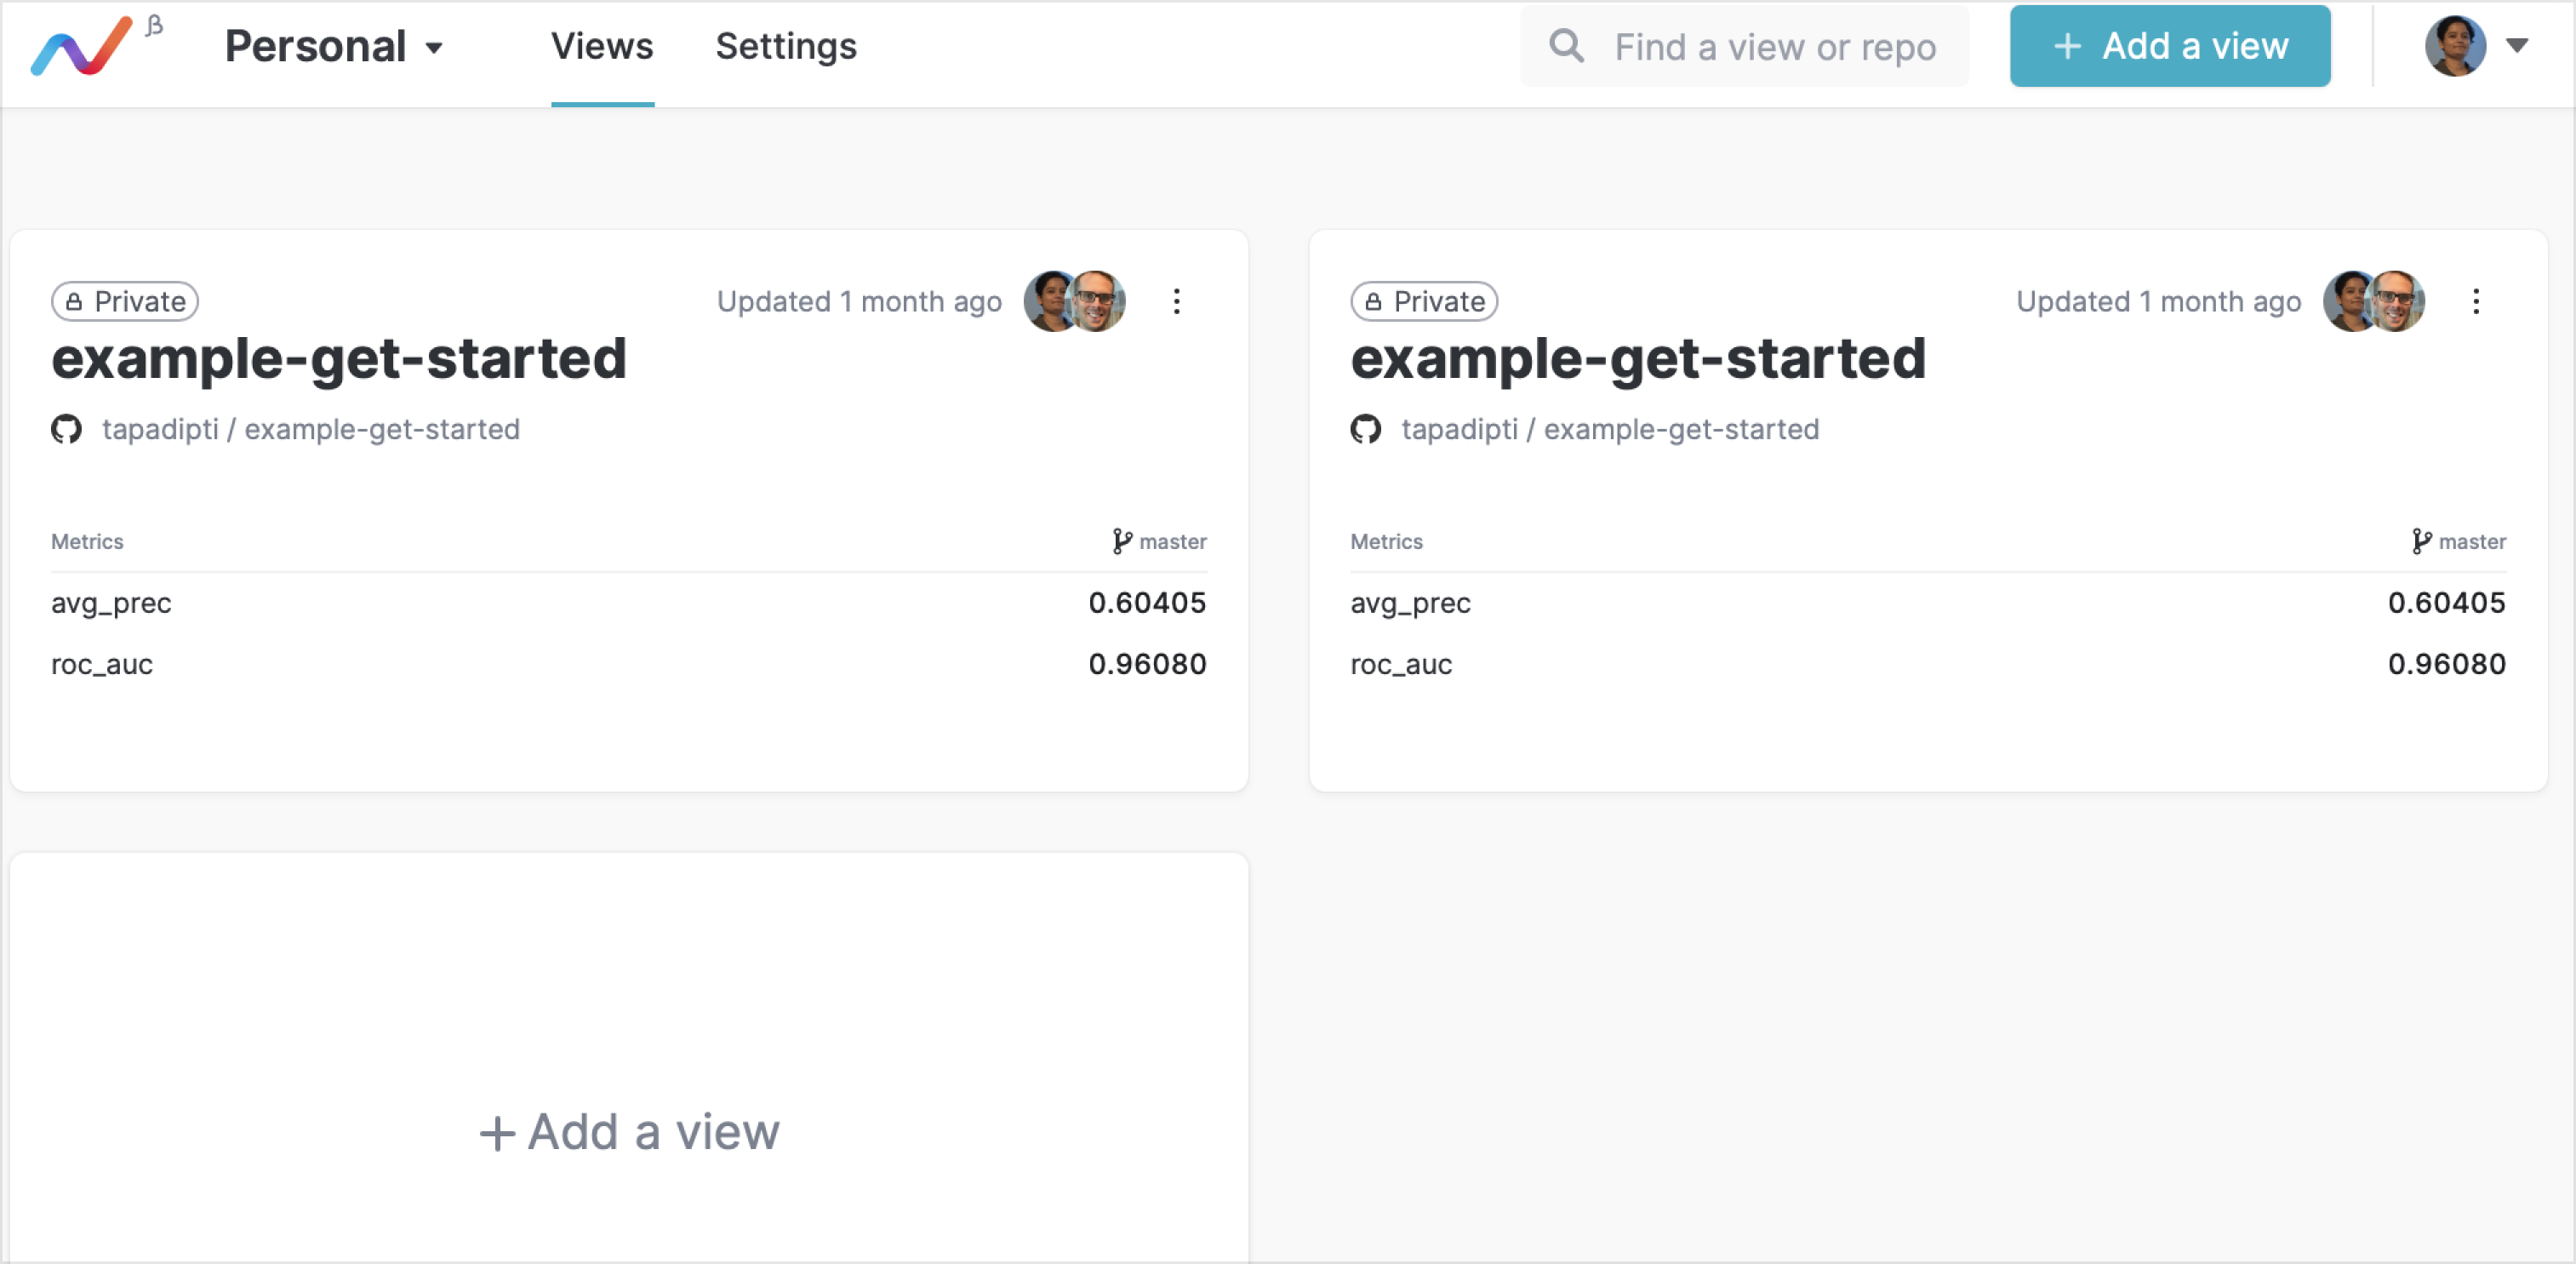
|  _When you first | ||
| login, an example view is already created for you to explore, and you can add | ||
| more views._ | ||
|
|
||
| When you first login, you will find that there already exists a view connecting | ||
| to an example DVC project. Use this view to explore the features that DVC Studio | ||
| has to offer. | ||
|
|
||
| DVC Studio automatically identifies datasets, metrics and hyperparameters in | ||
| your ML experiments. Each view on the dashboard displays the metrics. In the | ||
| figure above, you can see that `avg_prec` and `roc_auc` metrics are displayed. | ||
|
|
||
| ## Components of a view | ||
|
|
||
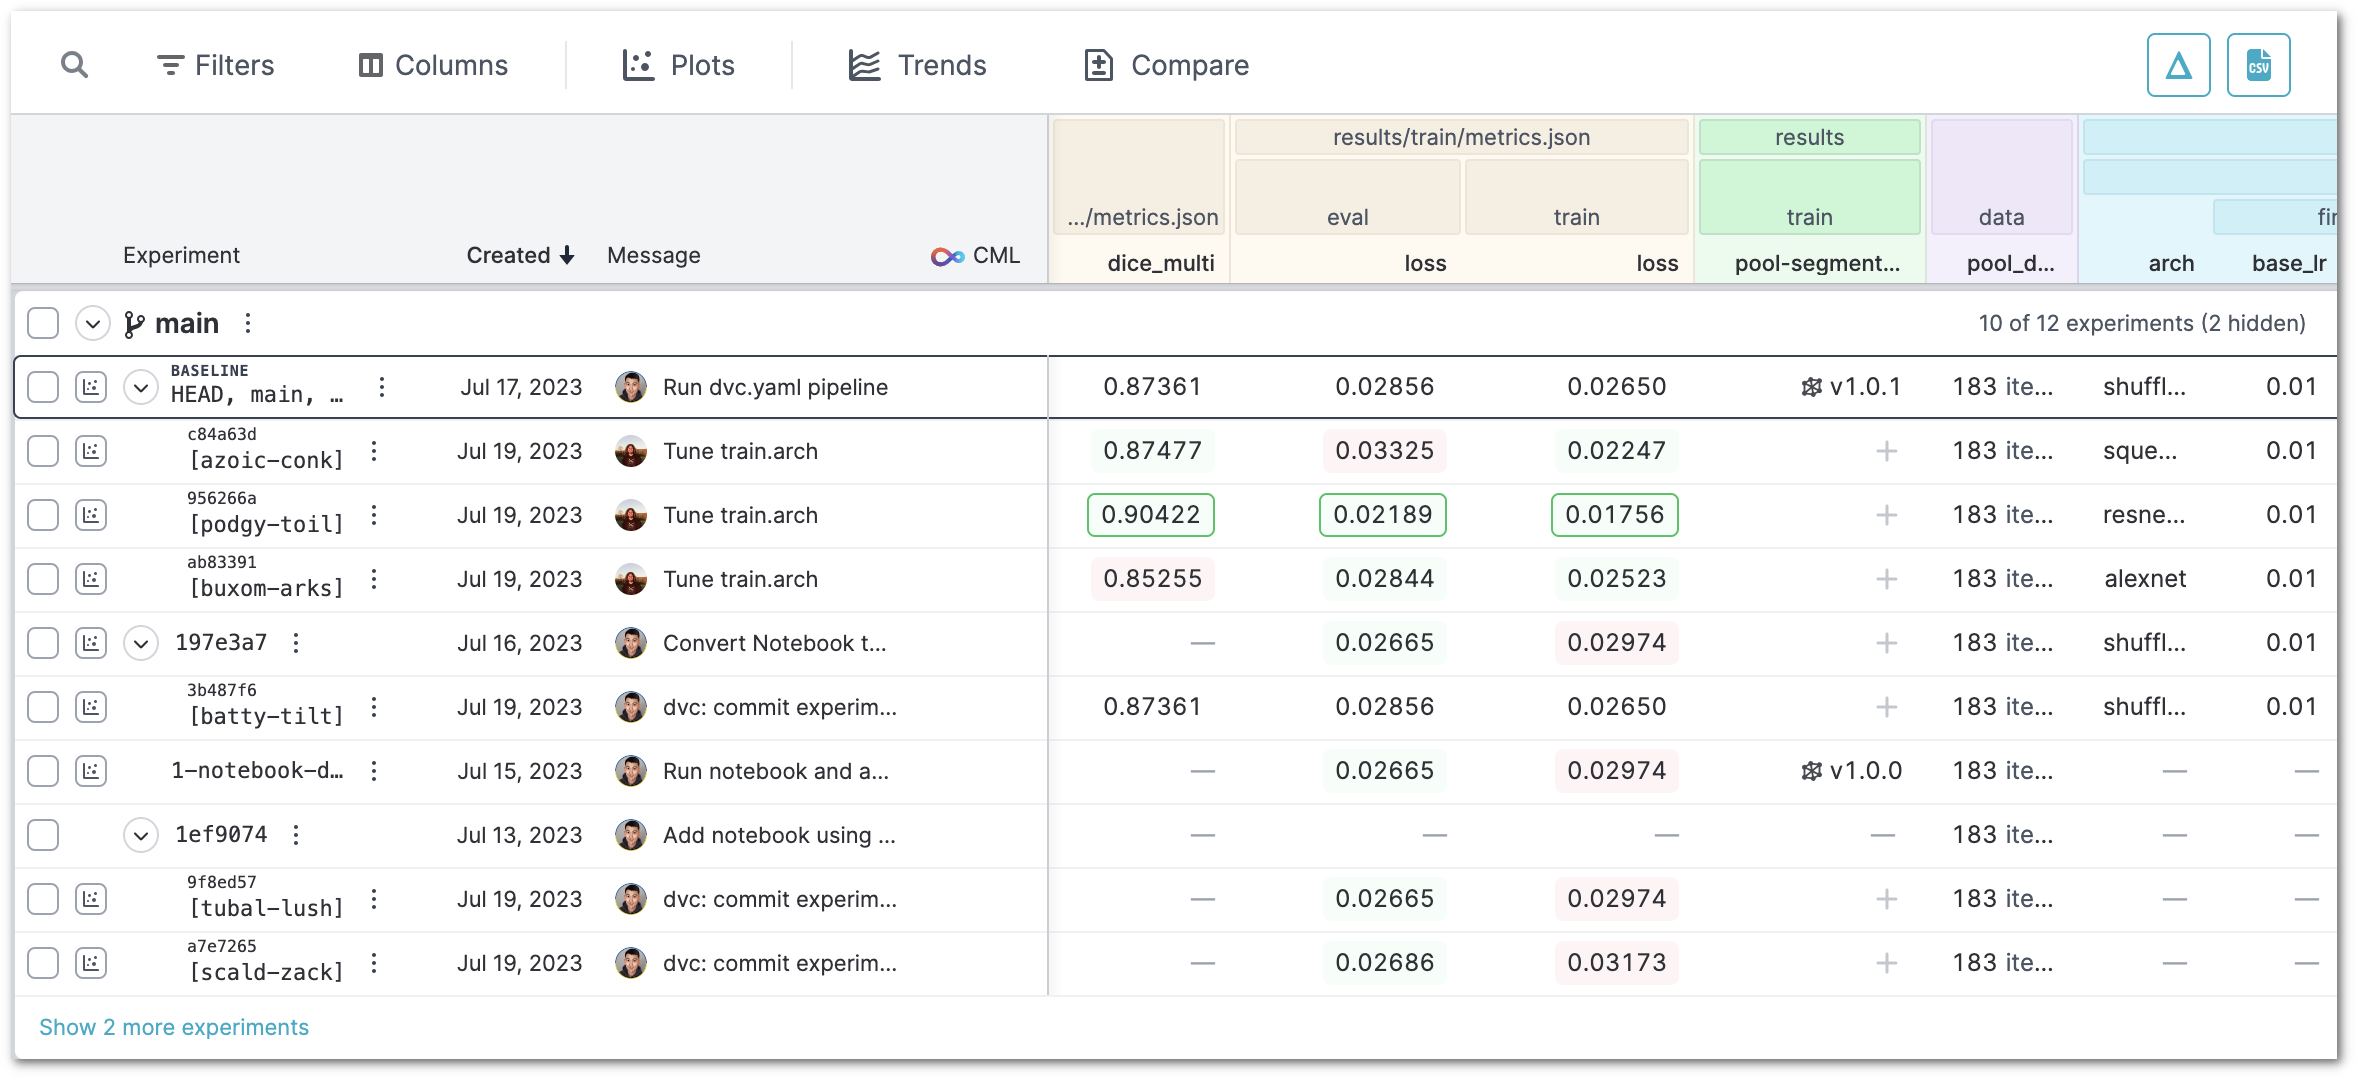
| You can dive deep into all the experiments committed to the repo. For this, open | ||
| the view by clicking on the view name (in this case, `example-get-started`). | ||
|
|
||
| A table will be generated as shown below. This includes metrics, hyperparameters | ||
| and information about the datasets. All the data is flattened and neatly | ||
| presented for you to evaluate and compare the experiments. | ||
|
|
||
|  | ||
|
|
||
| This tabular display has the following components: | ||
|
|
||
| - The branches in your Git repository. | ||
| - All commits in each branch. Each commit, corresponding to a single row in the | ||
| table, represents an experiment. | ||
| - Values of all the metrics, files and parameters in the given commits; | ||
| corresponding to the table columns. | ||
| - Various buttons for performing actions: | ||
| - **Filters:** Filter commits | ||
| - **Columns:** Select columns to display | ||
| - **Show plots:** Show plots for the selected commits | ||
| - **Compare:** Compare different experiements | ||
| - **Run:** Run experiments by selecting any one commit (Refer | ||
| [here](/doc/studio/run-experiments) for how to run experiments) | ||
| - **Trends:** Generate trend charts to show metric evolution over time | ||
| - **Delta mode:** Toggle between absolute values and difference from the first | ||
| row | ||
|
|
||
| You can connect to additional repositories and add more views as needed. You can | ||
| find out how to do this in the next section. |
| Original file line number | Diff line number | Diff line change |
|---|---|---|
| @@ -0,0 +1,25 @@ | ||
| # DVC Studio | ||
|
|
||
| [`DVC Studio`](https://studio.iterative.ai/) is a comprehensive and interactive | ||
| collaboration tool for your Machine Learning projects. | ||
|
|
||
| Using the power of leading open-source tools DVC, CML and Git, it enables you to | ||
| seamlessly manage data and models, run and track experiments, and visualize and | ||
| share results. | ||
|
|
||
| Project website: https://studio.iterative.ai | ||
|
|
||
|  _DVC Studio experiments | ||
| dashboard_ | ||
|
|
||
| Use DVC, CML and Studio to: | ||
|
|
||
| - **Visualize, collaborate, and do everything that a regular ML tracking tool | ||
| does.** | ||
|
|
||
| - **Keep your code, data and model connected at all times.** | ||
|
|
||
| - **Use the power of Git to track and preserve all your experiments.** | ||
|
|
||
| - **Run CI/CD for your ML projects on cloud resources of your choice without any | ||
| new tools.** |
| Original file line number | Diff line number | Diff line change |
|---|---|---|
| @@ -0,0 +1,28 @@ | ||
| # Run Experiments | ||
|
|
||
| You can also run your ML experiments directly from DVC Studio. Your regular | ||
| CI/CD set-up is used to run the experiments. For instance, | ||
| [CML](https://dvc.org/doc/cml) Github Actions can be used to run ML experiments | ||
| on each new commit. | ||
|
|
||
| > Note that you cannot run experiments on the demo view (`example-get-started`) | ||
| > that is provided to you by default. Once you create views for your ML project | ||
| > repositories, you can follow the instructions given below and run experiments | ||
| > directly from DVC Studio. | ||
|
|
||
| To run experiments from DVC Studio, select the commit that you want to use and | ||
| click the `Run` button. A form will let you to specify all the changes that you | ||
| want to make to your experiment input files/dirs and parameters. | ||
|
|
||
| <img src="https://static.iterative.ai/img/studio/cml.png" alt="drawing" width="300"/> | ||
|
|
||
| The default values in this form are extracted from your selected commit. For | ||
| instance, in the given example, `max_features` can be increased to 4000, | ||
| `ngrams` can be changed to 2, and so on. Enter your commit message and | ||
| description, select the branch to commit to (either the base branch or a new | ||
| branch), and click on `Commit changes`. | ||
|
|
||
| Now, the CI/CD pipeline that you have set up (eg, Github Actions) will be | ||
| invoked to run the experiment. If your refresh the view (reload the page), the | ||
| experiment (i.e. the commit that you just pushed) along with its results | ||
| (metrics) will be included in the list of all commits. |
| Original file line number | Diff line number | Diff line change |
|---|---|---|
| @@ -0,0 +1,73 @@ | ||
| # Teams | ||
|
|
||
| So far, you have seen how you can create personal and public views. In this | ||
| section, we will illustrate how you can create teams. In DVC Studio, you can | ||
| define teams with one or more team members. The team members are also called | ||
| collaborators, and you can assign different roles to the collaborators. The | ||
| views that you create in your team's page will be accessible to all members of | ||
| the team. | ||
|
|
||
| ## Roles | ||
|
|
||
| Team members can have different roles. | ||
|
|
||
| - **View.** Users with the View access cannot edit team settings or create new | ||
| views within the team's page. They have read-only access to the views created | ||
| by other team members. | ||
| - **Edit.** In addition to accessing all the team's views, users with the Edit | ||
| role can also create new views for the team, edit the views' settings, and run | ||
| experiments. | ||
| - **Admin.** Admin users have full access to the team's views and settings. They | ||
| can do everything that viewers and editors can do. Additionally, they can add | ||
| (invite) and remove collaborators as well as change team settings such as | ||
| cloud credentials (data remotes). | ||
|
|
||
| ## Create a team | ||
|
|
||
| To create a team, click on the drop down next to `Personal`. All the teams that | ||
| you have created so far will be listed within "Teams" in the drop down menu. If | ||
| you have not created any team so far, this list will be empty. Now, click on | ||
| `Create a team`.  | ||
|
|
||
| You will be asked to enter the URL namespace for your team. Enter a unique name. | ||
| The URL for your team will be formed using this name. | ||
|  | ||
|
|
||
| Then, click on the `Create team` button on the top right corner. | ||
|
|
||
| ## Invite collaborators | ||
|
|
||
| The next step is to invite the team members (or collaborators) for your team. | ||
| You can also choose to skip adding collaborators at this point. For this, click | ||
| on `Skip and Close` on the top right corner. You will be able to add | ||
| collaborators by accessing team settings later. | ||
|
|
||
| If you wish to add collaborators now, enter their email addresses. An email | ||
| invite will be sent to each invitee, and they will have to join using their | ||
| Github, Gitlab or Bitbucket account. | ||
|
|
||
| You can add multiple collaborators. Each collaborator can be assigned the Admin, | ||
| Edit, or View role.  | ||
|
|
||
| Once you have added the people that you wish to add to your team, click on | ||
| `Send Invites and Close` on the top right corner. | ||
|
|
||
| ## Manage your team and its views | ||
|
|
||
| Once you have created the team, the team's page opens up. | ||
|
|
||
|  | ||
|
|
||
| On this page, you can perform three types of tasks: | ||
|
|
||
| - **Add a view.** Click on the `View` menu item to add views to the team's page. | ||
| The process for adding a view is the same as that for adding personal views | ||
| ([instructions](/doc/studio/create-view)). However, the views that you create | ||
| within the team will be accessible to all members (collaborators) of the team. | ||
|
|
||
| - **Edit collaborators.** You can click on the `Team` menu item to edit the | ||
| collaborators in the team. | ||
|
|
||
| - **Change settings.** Finally, you can click on the `Settings` menu item to | ||
| change the team name, add credentials for the data remotes, and delete the | ||
| team.  | ||
| Original file line number | Diff line number | Diff line change |
|---|---|---|
| @@ -0,0 +1,40 @@ | ||
| # Visualize and Compare Experiments | ||
|
|
||
| You can visualize and compare experiements using a variety of tools. | ||
|
|
||
| ## Generate metric plots | ||
|
|
||
| You can visualize certain metrics of machine learning experiments as plots. | ||
| Usual plot examples are AUC curves, loss functions, and confusion matrices, | ||
| among others. This type of metrics files are created by users, or generated by | ||
| user data processing code, and can be defined in dvc.yaml (plots field) for | ||
| tracking (optional). Refer to the | ||
| [DVC plots documentation](/doc/command-reference/plots) for details on how plots | ||
| are generated. | ||
|
|
||
| To generate metric plots, select one or more experiements (represented by the | ||
| commits), and click on the 'Show plots' button. | ||
|
|
||
| <img src="https://static.iterative.ai/img/studio/select_commits.png" alt="drawing" width="300"/> | ||
|
|
||
| The plots will appear below the tabular display. If you have selected more than | ||
| one experiment, you can use the plots to compare them. | ||
|
|
||
| <img src="https://static.iterative.ai/img/studio/plots.png" alt="drawing" width="300"/> | ||
|
|
||
| ## Generate trend charts | ||
|
|
||
| Click on the Trends button to generate a plot of how the metrics changed over | ||
| the course of the different experiments. For each metric, the trend charts show | ||
|
Comment on lines
+27
to
+28
There was a problem hiding this comment. Choose a reason for hiding this commentThe reason will be displayed to describe this comment to others. Learn more. There was a problem hiding this comment. Choose a reason for hiding this commentThe reason will be displayed to describe this comment to others. Learn more. Maybe also for There was a problem hiding this comment. Choose a reason for hiding this commentThe reason will be displayed to describe this comment to others. Learn more. Added to new ticket #2468 |
||
| how the metric changed from one commit to another. You can include one or more | ||
| branches in the trend chart. | ||
|
|
||
| <img src="https://static.iterative.ai/img/studio/trends.png" alt="drawing" width="300"/> | ||
|
|
||
| ## Compare experiements | ||
|
|
||
| To compare different experiements, select two experiements (represented by the | ||
| commits), and click on the `Compare` button. The metrics, parametes and files in | ||
| the selected experiments will be displayed side by side for easy comparison. | ||
|
|
||
| <img src="https://static.iterative.ai/img/studio/compare.png" alt="drawing" width="300"/> | ||

There was a problem hiding this comment.
Choose a reason for hiding this comment
The reason will be displayed to describe this comment to others. Learn more.
This should probably be moved down after or even merged with Invite collaborators.
There was a problem hiding this comment.
Choose a reason for hiding this comment
The reason will be displayed to describe this comment to others. Learn more.
Added to new ticket #2468