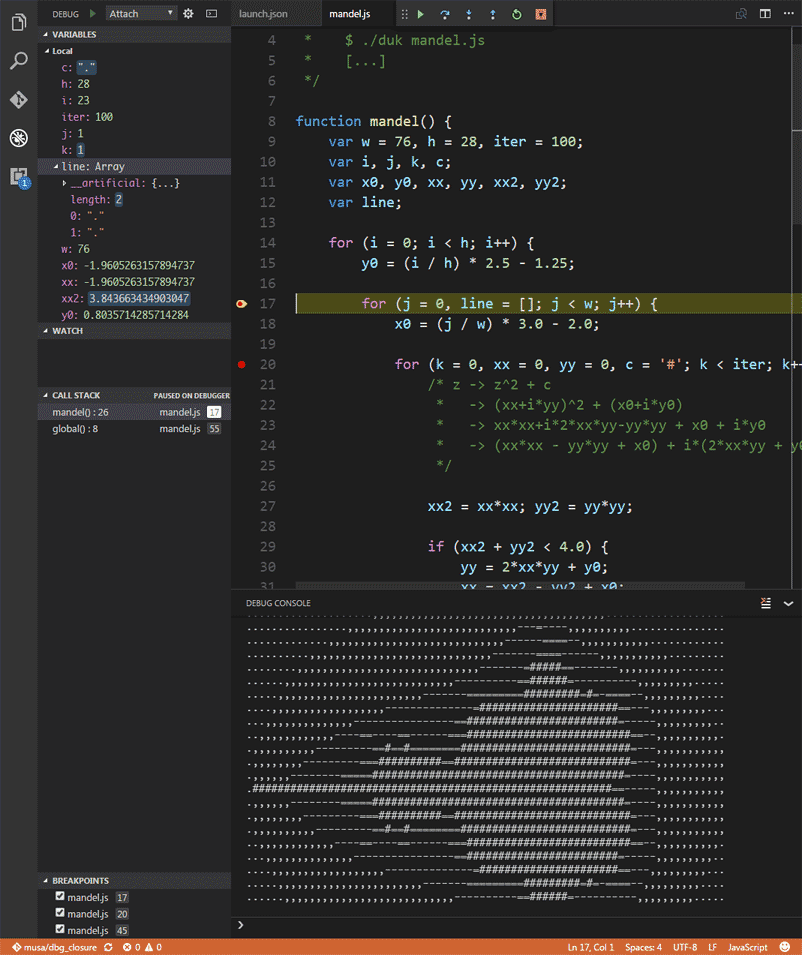
A Duktape debug client for Visual Studio Code.
- v1.5.*+
- v2.*+
See (#references) below for more information.
- Local scope inspection (Duktape only provides local scope).
- "this" object binding inspection.
- Deep object inspection (nested objects).
- Source map support. *inlined currently unsupported*
- Console input evals.
- Artificial property inspection.
It works. I'd like to refactor the code and polish it more as I find the time.
Create a new launch.json configuration file and configure the address and port to your debug server's listening address and port.
// Add a new configuration to your 'launch.json' under
// your workspace root/.vscode/ folder.
// Or select 'Add Configuration' from the debug bar dropdown menu.
"configurations": [
        {
            "name"        : "Duk Attach",
            "type"        : "duk",
            "request"     : "attach",
            "stopOnEntry" : false,

            "address"     : "localhost",
            "port"        : 9091,

            "localRoots"  : [ "${workspaceRoot}" ],

            "sourceMaps"  : true,
            "outDir"      : "${workspaceRoot}/bin"
}If you'd like to see the network traffic exchanged between the client and server, set the following option in your launch.json configuration:
"debugLog" : trueFor the debugger client to work with your Duktape host application, you must enable the following preprocessor macros:
// See the official duktape documentation to learn
// how to configure these for your specific runtime version:
// https://github.com/svaarala/duktape/blob/master/doc/duk-config.rst

// Required to enable debugger support:
#define DUK_USE_DEBUGGER_SUPPORT
#define DUK_USE_INTERRUPT_COUNTER

// To enable heap object inspection:
// Note: If this option is not enabled, you will only
//  be able to inspect local variables in the call stack.
//  No object properties will be inspectble.
#define DUK_USE_DEBUGGER_INSPECT

// (Optional) To forward log calls to the client:
#define DUK_USE_DEBUGGER_FWD_LOGGING
#define DUK_USE_DEBUGGER_FWD_PRINTALERT

// (Optional) To notify the client when an error is about to be thrown:
#define DUK_USE_DEBUGGER_THROW_NOTIFY

// (Optional) To pause on an uncaught errors:
#define DUK_USE_DEBUGGER_PAUSE_UNCAUGHT


// The following option to enable the 'DumpHeap' command is currently unsupported.
#define DUK_USE_DEBUGGER_DUMPHEAP
For more information about the aforementioned options, see this entry on the Duktape wiki.
You must also have a transport layer written in your Duktape host application to enable debugging via duk_debugger_attach() or duk_debugger_attach_custom(). You may use Duktape's reference implementation.
For an example of an application with debugger support, please see Duktape's command line app.
To run and debug this extension locally, clone this repository load the folder in VSCode and then run the Launch Duktape Debugger Extension task. This will open a new window with the debugger enabled.
- https://code.visualstudio.com/docs/extensions/overview
- https://code.visualstudio.com/docs/extensions/example-debuggers
The adapter uses the debugger protocol for Duktape version 1.5+ of, Including v2.*+. See: debugger.rst.
Special thanks to Sami Vaarala for developing Duktape, and for freely sharing it with the community. A "thank you" also to the VSCode team for facilitating their open-source IDE and the ability to easily make extensions for it. And finally, to those who has contributed to this project via bug reports or pull requests, thank you.
This code contains portions borrowed or adapted from the vscode nodeJS debugger and Sami Vaarala's web-based nodeJS reference implementation of a Duktape debug client.
(c) Harold Brenes 2016-2017
Ἐμοὶ γὰρ, τὸ ζῆν Χριστὸς, καὶ τὸ ἀποθανεῖν, κέρδος.
