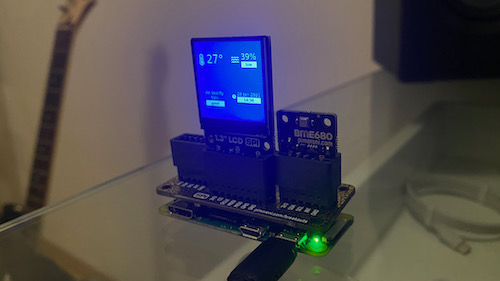
Read the data from pimoroni BME680 and display on pimoroni SPI screen
- wkhtmltopdf(https://wkhtmltopdf.org/downloads.html)
- Enable SPI and I2C
- Install the dependencies
sudo apt-get install python3-venv python3-dev libatlas-base-dev wkhtmltopdf libopenjp2-7
- Create the folder to store the virtualenv
mkdir pi_weatherstation

cd pi_weatherstation
- Create the virtualenv and activate it
python3 -m venv .env

source .env/bin/activate
- Install the via pip with the sensors dependencies
pip install pi_weatherstation\[st7789,bme680\]
- Run
pi_weatherstation -l debug
You can copy the example config file from https://github.com/guilhermef/pi_weatherstation/blob/main/examples/config.ini
The field metrics_location_label will be added as a location label on prometheus.
Then you can run pi_weatherstation -c <path to config.ini>
This will also start a prometheus metric server that you can use to scrape. You can configure a label name location if you have multiple instances.
Install Prometheus on RaspberryPI
Create a free account on Grafana Cloud
Copy the existing prometheus.yml file to scrape the local pi_weatherstation, and add your remote_write auth on it. https://github.com/guilhermef/pi_weatherstation/blob/main/examples/prometheus.yml
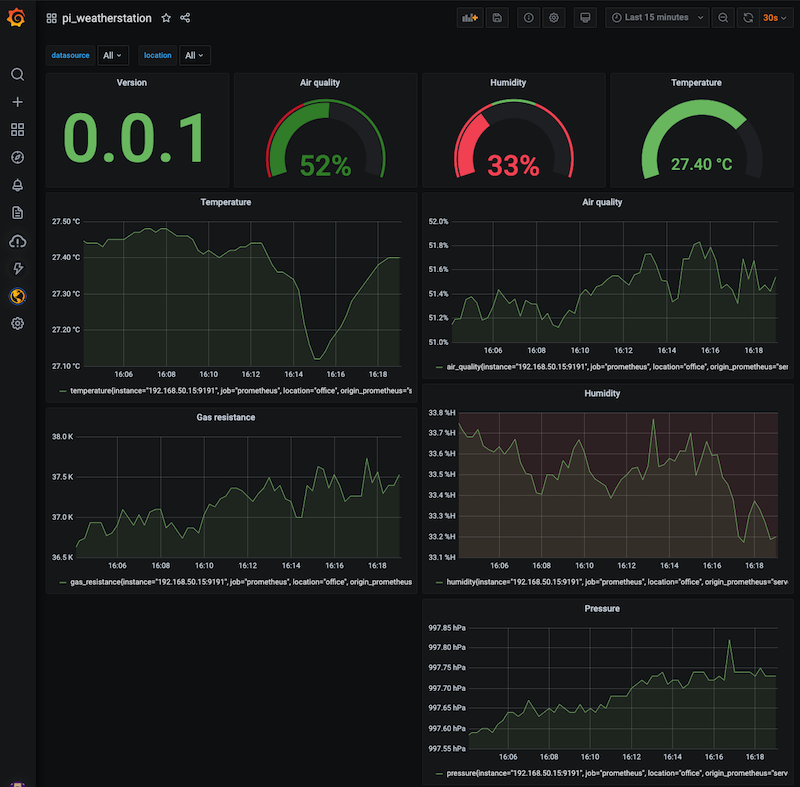
Import the example dashboard on your new Grafana: https://github.com/guilhermef/pi_weatherstation/blob/main/examples/grafana_dashboard.json
If you want, you can use the systemd service unit file as an example
https://github.com/guilhermef/pi_weatherstation/blob/main/examples/pi_weatherstation.service
to /etc/systemd/system/pi_weatherstation.service
then, run:
sudo systemctl daemon-reload
sudo systemctl enable pi_weatherstation.service
sudo systemctl start pi_weatherstation.service

