First build the plugin. Minimum requirements:
- Java >= 1.8
- Apache Maven >= 3.3
- From plugin root:
mvn clean install - Ensure that
custom-usermonitoring-1.0.0-SNAPSHOT.zipwas generated in{plugin_root}/target/releases - Change directory to
{elasticsearch_root}/bin - Remove explain plugin if it was previously installed:
./elasticsearch-plugin remove custom-usermonitoring - Install plugin:
./elasticsearch-plugin install -b file:{plugin_root}/target/releases/custom-usermonitoring-1.0.0-SNAPSHOT.zip - Run elasticsearch:
./elasticsearch
This plugin has 4 features:
(Disabled by default, In Test) Doesn't make sense to do aggregation by field "_id", this can lead to OOM. This plugin trying to find search requests with aggregation by "_id" and returns BAD_REQUEST status.
This plugin is complete replacement of standard elasticsearch slowlog functionality with additional feature - information about username of query initiator.
Optionally you can append information about user roles by property plugin.custom.usermonitoring.slowlog.append.roles (Default: false).
All configurations are the like in default Slowlog functionality.
This plugin responsible for limit of rate and parallel request per user. All configurations are per user. This limiter works only per node, not for the whole cluster. Limitations work only with authorized users on Get\Search requests to non-system indices.
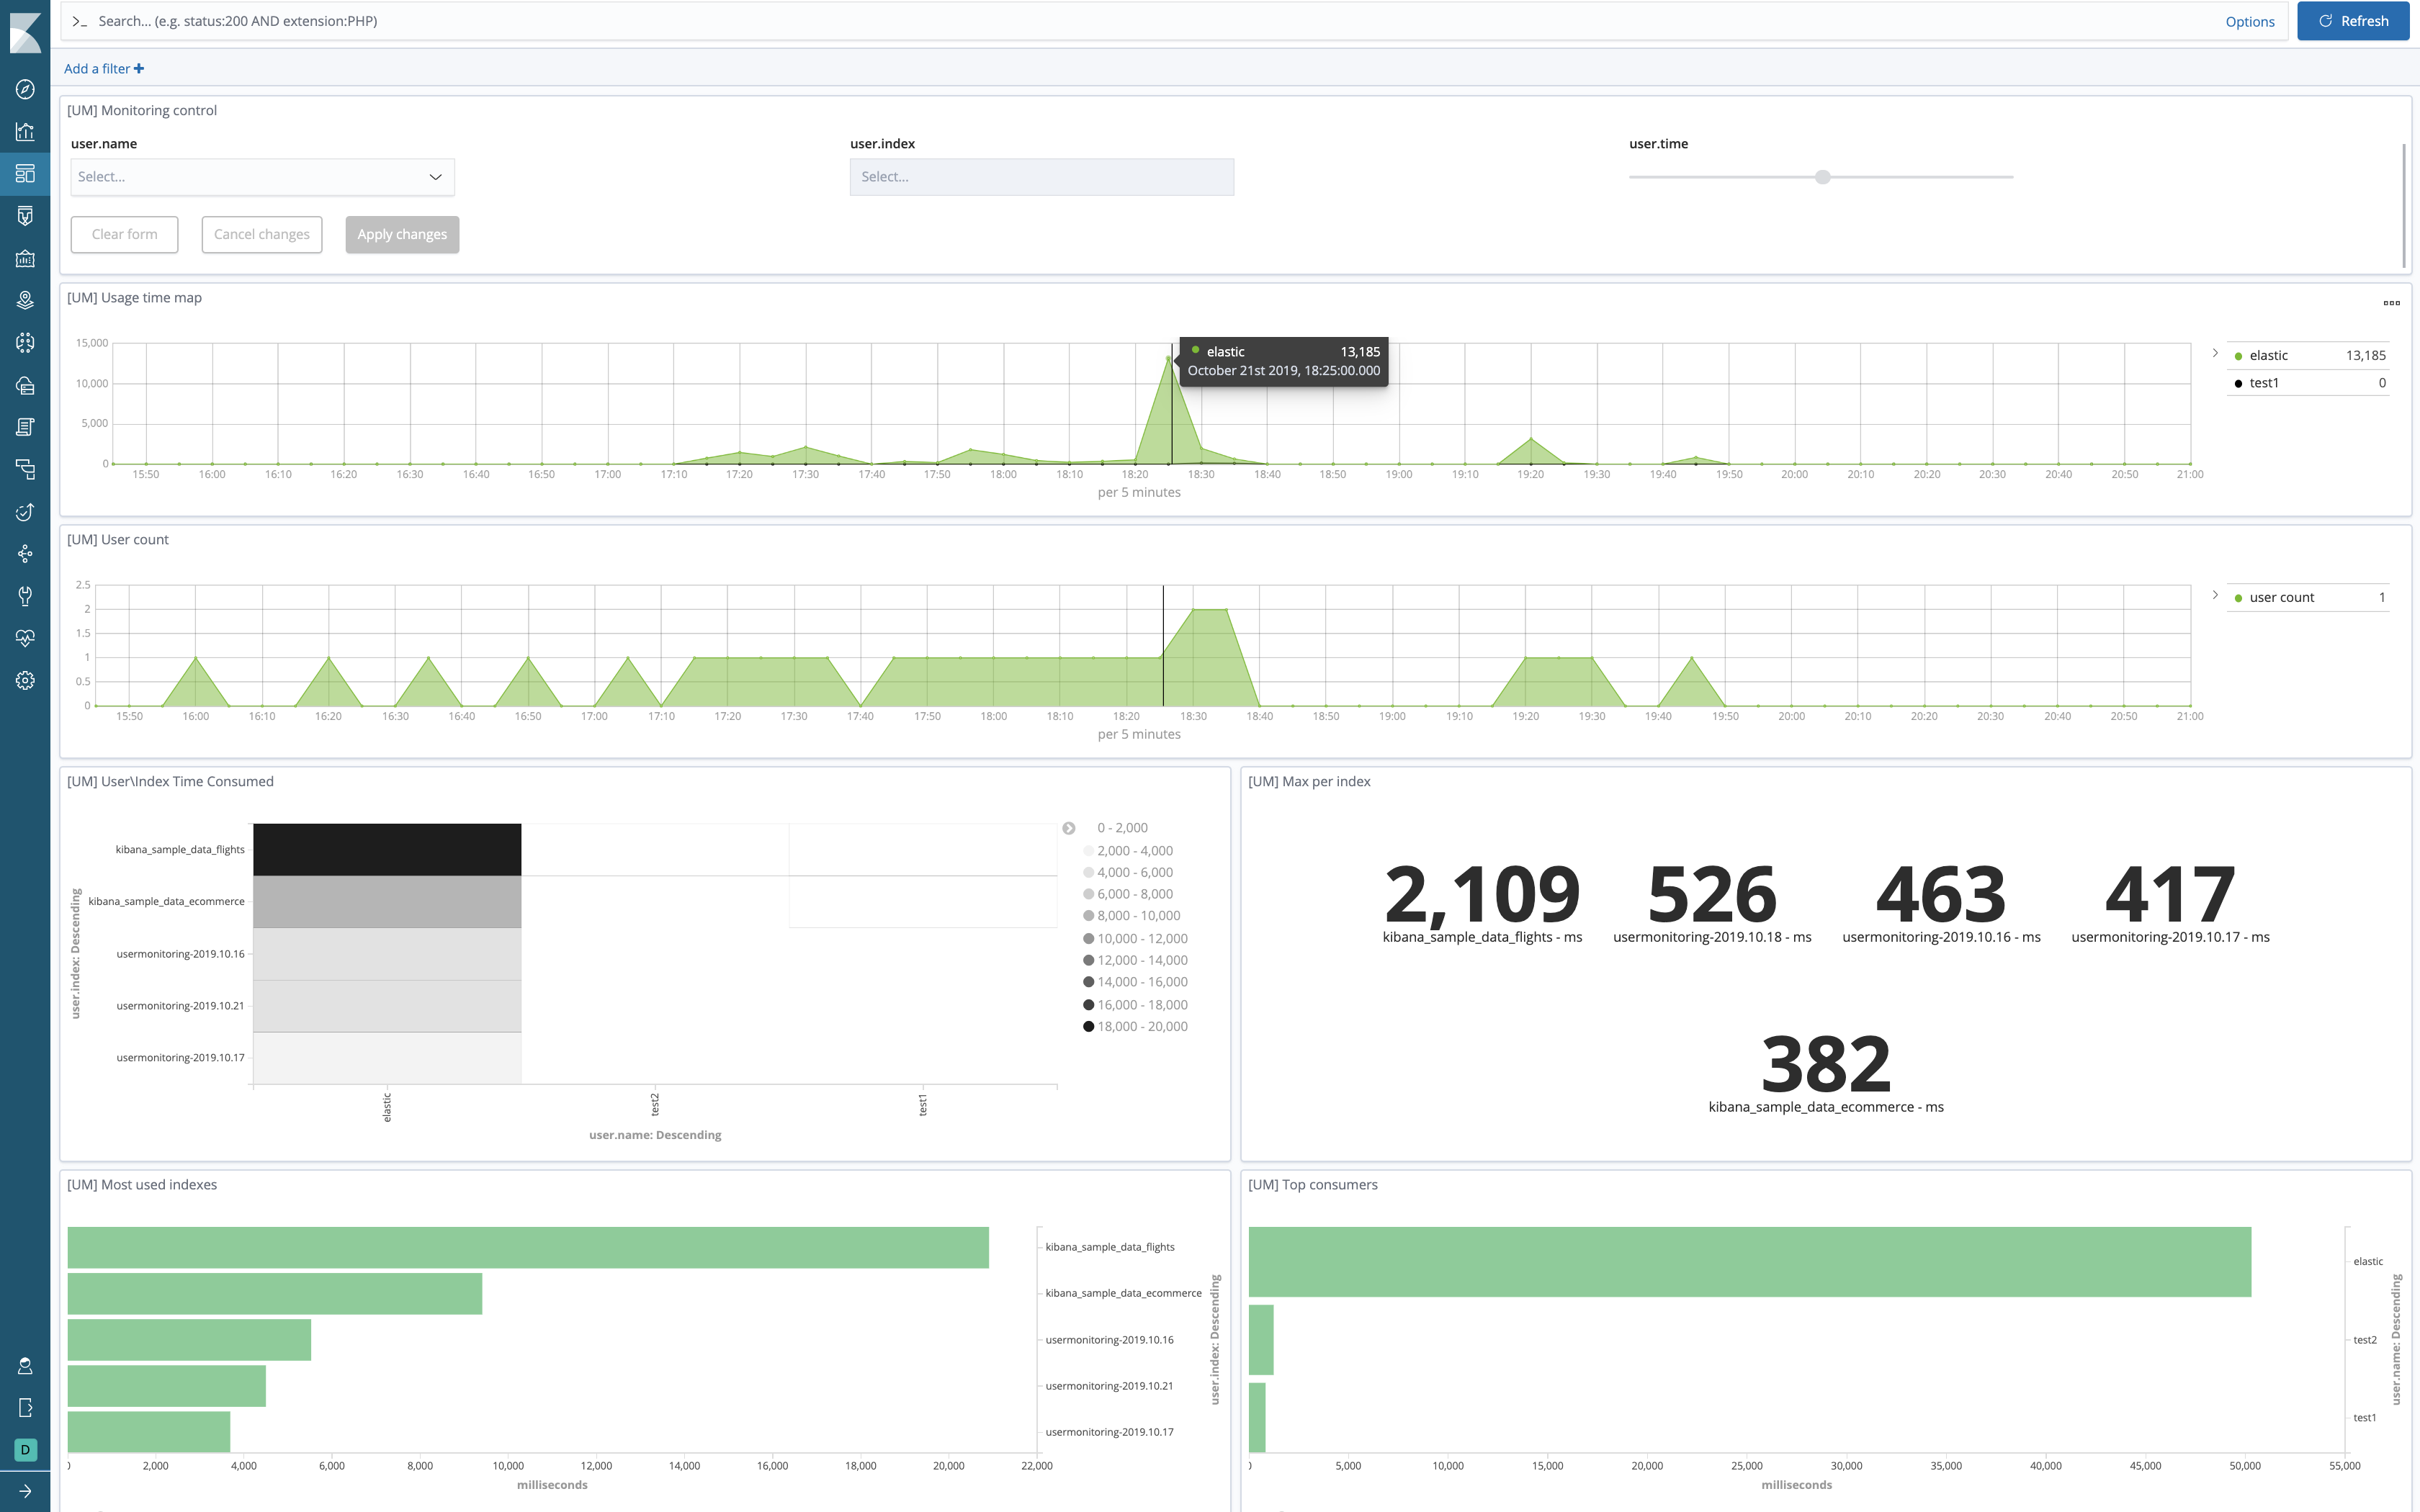
This plugin collect information about how many CPU time consumed user for query by some period of time and print it to logger(file).
In addition you can install Kibana dashboard for monitoring user activity and consumed CPU time. You have to:
- Enable
consumptionfeature and configure log4j2.properties to print logs to separate file - Add usermonitoring template mapping from
config/commands.txtfile - Add user_monitoring ingest pipeline from
config/commands.txtfile - Install filebeat on each DATA node, configure it with
config/filebeat_template.yml - Import
config/kibana_dashboard.jsonto Kibana (Management->Saved Objects->Import)
Default values in elasticsearch.yml
plugin.custom.usermonitoring:
    enabled: true
    filter.id.aggregation:
        enabled: false ##Functionality disabled by default (In Test)
    slowlog:
      enabled: true
      append.roles: false ##Ability appned also information about user roles
    request.limiter:
      enabled: true
      ratelimit:
        enabled: true  ##Enable\disable requests rate limit per user
        permitsPerSecond: 2  ##Count of requests which user can do per second
        waitingTimeSec: 30 ##When per user request rate is exceeded, new incoming queries are enqueued. This configuration sets up the time a query can wait in the queue before it is discarded
      parallel:
        max: 10  ##If the user will have this value of concurrent requests at the same time, then the next request will be rejected
        warn: 7  ##If the user will have more than this value of concurrent requests at the same time, then information about this activity will be added to log

    consumption:
      enabled: true
      interval.seconds: 60 ##Printing interval
      skip:
        zerotime: true ##Skip printing user if consumed time < 1ms
        users:  ##Users which should not be analyzed
          - "x_pack"
          - "_xpack_security"
        indicies.prefix:
          - "." ##Indices which has to be ignored (Default: system indices)
Logging properties:
To log4j2.properties
appender.user_monitoring_rolling.type = RollingFile
appender.user_monitoring_rolling.name = user_monitoring_rolling
appender.user_monitoring_rolling.fileName = user_monitoring.log
appender.user_monitoring_rolling.layout.type = PatternLayout
appender.user_monitoring_rolling.layout.pattern = [%d{ISO8601}][%-5p][%-25c] [%node_name]%marker %.10000m%n
appender.user_monitoring_rolling.filePattern = user_monitoring-%d{yyyy-MM-dd}.log
appender.user_monitoring_rolling.policies.type = Policies
appender.user_monitoring_rolling.policies.time.type = TimeBasedTriggeringPolicy
appender.user_monitoring_rolling.policies.time.interval = 1

appender.user_monitoring_rolling.policies.time.modulate = true
logger.user_monitoring_rolling.name = custom.usermonitoring.logger
logger.user_monitoring_rolling.level = info
logger.user_monitoring_rolling.appenderRef.user_monitoring_rolling.ref = user_monitoring_rolling
logger.user_monitoring_rolling.additivity = false
[2019-10-08T17:18:05,237][INFO ][custom.usermonitoring.logger] [esd2] User[elastic] consumed [376]ms for index[index1-2019]
[2019-10-08T17:18:15,288][INFO ][custom.usermonitoring.logger] [esd2] User[elastic] consumed [115]ms for index[index2-2019]
Current master fully compatible with 6.7 elasticsearch version (+ all minors version).
To build for specific minor you have to change elasticsearch.version property in a pom.xml file.

