Declarative visualization for Elm.
This package allows you to create data visualizations in Elm, following the Vega-Lite visualization schema. It generates JSON specifications that may be sent to the Vega-Lite runtime to create the output.
If you wish to create Vega (as opposed to Vega-Lite) output, see the sister package elm-vega.
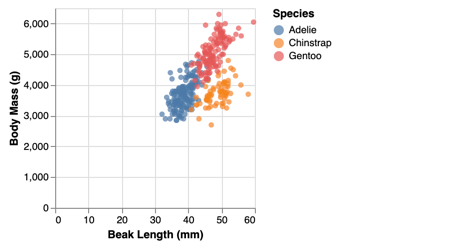
A simple scatterplot encoding penguin morphology with position and species with colour:
let
    path =
        "https://cdn.jsdelivr.net/npm/vega-datasets@2/data/"

    data =
        dataFromUrl (path ++ "penguins.json") []

    enc =
        encoding
            << position X [ pName "Beak Length (mm)", pQuant ]
            << position Y [ pName "Body Mass (g)", pQuant ]
            << color [ mName "Species" ]
in
toVegaLite [ data, enc [], circle [] ]
This generates a JSON specification that when sent to the Vega-Lite runtime produces the following output:
There is a demand for good visualization packages with Elm. There are certainly data visualization packages available, ranging from low level SVG rendering through focussed charting packages (e.g. line-charts) to a more comprehensive visualization library. The designs of each reflects a trade-off between concise expression, generalisability and comprehensive functionality.
Despite the availability of these packages, there is a space for a higher level data visualization package (avoiding, for example the need for explicit construction of chart axes) but one that offers the expressivity to create a wide range data visualization types and styles. In particular, no existing libraries offer easy interaction and view composition (building 'dashboards' comprising many chart types). elm-vegaLite is designed to fill that gap.
Characteristics of elm-vegaLite.
-
Built upon the widely used Vega-Lite specification that has an academic robustness and momentum behind its development. Vega-Lite is itself built upon the hugely influential Grammar of Graphics.
-
High-level declarative specification with best-practice defaults (a chart can be fully specified in as few as five lines of code).
-
Strict typing and friendly error messages means "the compiler is your friend" when building and debugging complex visualizations.
-
Flexible interaction for selecting, filtering and zooming built-in to the specification.
-
Hierarchical view composition allows complex visualization dashboards to be built from trees of simpler views.
Vega-Lite hits the sweet spot of abstraction between lower-level specifications such as D3 and higher level visualization software such as Tableau. By using JSON to fully encode a visualization specification, Vega-Lite is portable across a range of platforms and sits well within the JavaScript / Web ecosystem. Yet JSON is really an interchange format rather than one suited directly for visualization design and construction.
By wrapping Vega-Lite within the Elm language, we can avoid working with JSON directly and instead take advantage of a typed functional programming environment for improved error support and customisation. This greatly improves reusability of code (for example, it is easy to create custom chart types such as box-and-whisker plots that can be used with a range of datasets) and integration with larger programming projects.
Elm and elm-vegaLite have been used successfully with hundreds of students to teach Data Visualization combining the beginner-friendly design of Elm with the robust and theoretically underpinned design of a grammar of graphics. It integrates well with literate visualization to encourage good and reproducible practice in visualization design.
- To get started have a go creating your first elm-VegaLite visualization.
- For a more thorough set of examples/tutorial, see the gallery and walkthrough.
- To get coding, see the elm-vegaLite API documentation..
- Browse the elm-vegaLite examples folder.
- For an example of fully embedding an elm-vegaLite visualization in an elm SPA, see elm-embed-vegalite.
- You can also work with elm-vegaLite in litvis – a literate visualization notebook environment for embedding visualization specifications in a formatted text environment.
- For lower level and more expressive visualization in elm, see elm-vega that follows a similar approach to elm-vegalite.


