-
Notifications
You must be signed in to change notification settings - Fork 8.3k
New issue
Have a question about this project? Sign up for a free GitHub account to open an issue and contact its maintainers and the community.
By clicking “Sign up for GitHub”, you agree to our terms of service and privacy statement. We’ll occasionally send you account related emails.
Already on GitHub? Sign in to your account
Can kibana highlight specific query result in hitogram ? #974
Comments
|
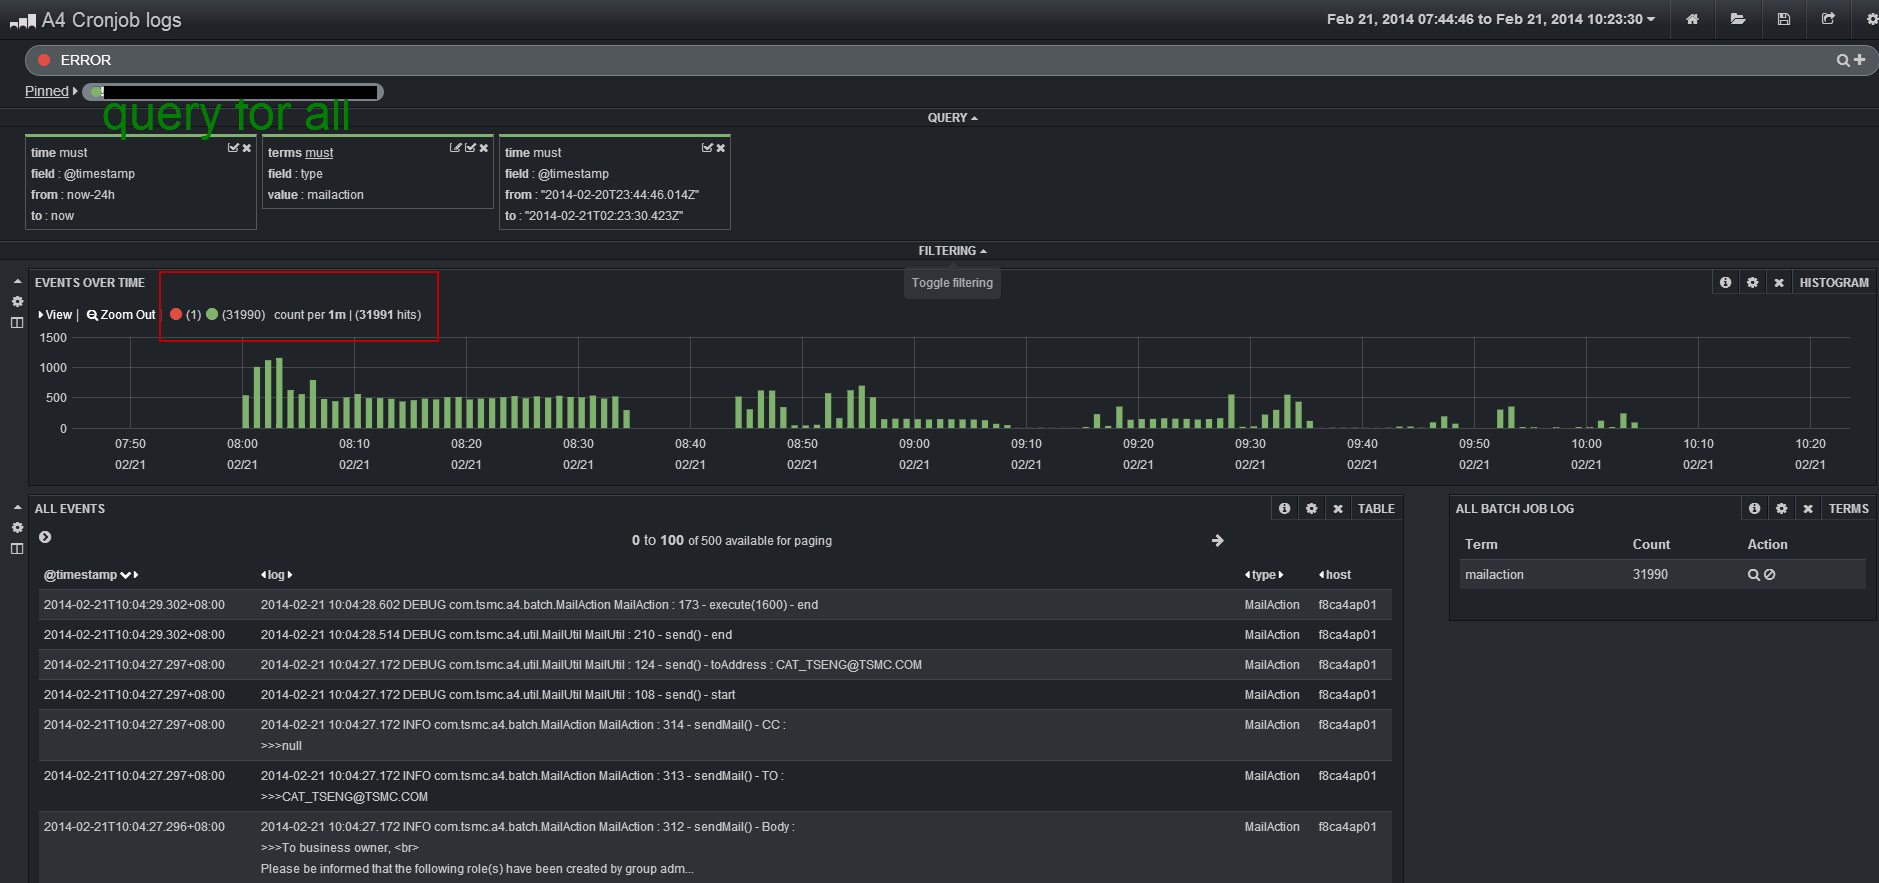
Try using Markers. See PR #640 for screenshots. You can add 'ERROR' as a marker to the histogram to allow you to see where in data the events lie. |
|
As rushi mentioned, the feature you're looking for is chart markers. |
|
But the marker can not change query with dynamic input.... |
w33ble
pushed a commit
to w33ble/kibana
that referenced
this issue
Sep 13, 2018
This was referenced Jul 5, 2021
Sign up for free
to join this conversation on GitHub.
Already have an account?
Sign in to comment

Hi I met a problem while trouble shooting my system with search logs through Kibana.
The scenario is that I have to query "ERROR" keyword, and view the other around logs in the meantime. Hence, I create 2 query, 1 for keyword, 1 for show all logs.
But after I give "ERROR" keyword query, I can not figure the Error happened time (The red point), as follows

Is there anything I can use for such scenario ?
The text was updated successfully, but these errors were encountered: