-
Notifications
You must be signed in to change notification settings - Fork 8.3k
New issue
Have a question about this project? Sign up for a free GitHub account to open an issue and contact its maintainers and the community.
By clicking “Sign up for GitHub”, you agree to our terms of service and privacy statement. We’ll occasionally send you account related emails.
Already on GitHub? Sign in to your account
[Lens] Replace basic table with EuiDataGrid #72504
Comments
The guidelines for EuiBasicTable vs EuiDataGrid usages state that the EuiBasicTable is for simple display of a "list of things in tabular format" while EuiDataGrid is specifically for large amounts of known and unkown data. For example, the correct usage of the basic table is on listing pages like Dashboard and Visualize items. The only reason the dataVis table uses the basic table is because the data grid didn't exist. But all implementations of user-generated table visualizations should use the EuiDataGrid component to be consistent.
What are the costs? Looking at the table, to me, it is a huge win for the user if we switch over to EuiDataGrid
I understand that there are performance issues right now, but they are actively being worked on. I'm not advocating for the switch to happen today, but we should consider the fact that we will lose out on a lot of features if we don't even consider switching. cc @AlonaNadler : Also if you can find our requirements/necessary features for table visualizations to link back to, that would be really helpful. Even future features. |
This isn't in basic table. If it exists in Kibana, it's an abstraction. I would also echo @cchaos' reasoning for using grid. Using a side by side comparison like this is a little tough when we're using boolean classification, since a lot of these read closer to "yes for both, but grid handles this better in this situation". The EUI docs summarize the differences pretty simply:
End of day this is what data grid was built for and what discover will will be (we're aiming for consistency). Virtualization is being prioritized for data-grid during this current minor. I'm confident performance shouldn't be a blocker, and parallel work can be done by the two teams to deliver for the near future. This comparison also leaves out some pretty considerable design advantages of grid for the Lens usage, primary that it operates in small spaces extremely well and was built for dashboard usage. The tables only work well in wide formats. |
|
I'm trying to use side-by-side comparisons because it doesn't seem like this comparison had been made in the context of Lens or other visualization builders. Since you're suggesting extra criteria that I hadn't considered, could you try formatting it in the context of a comparison? For example:
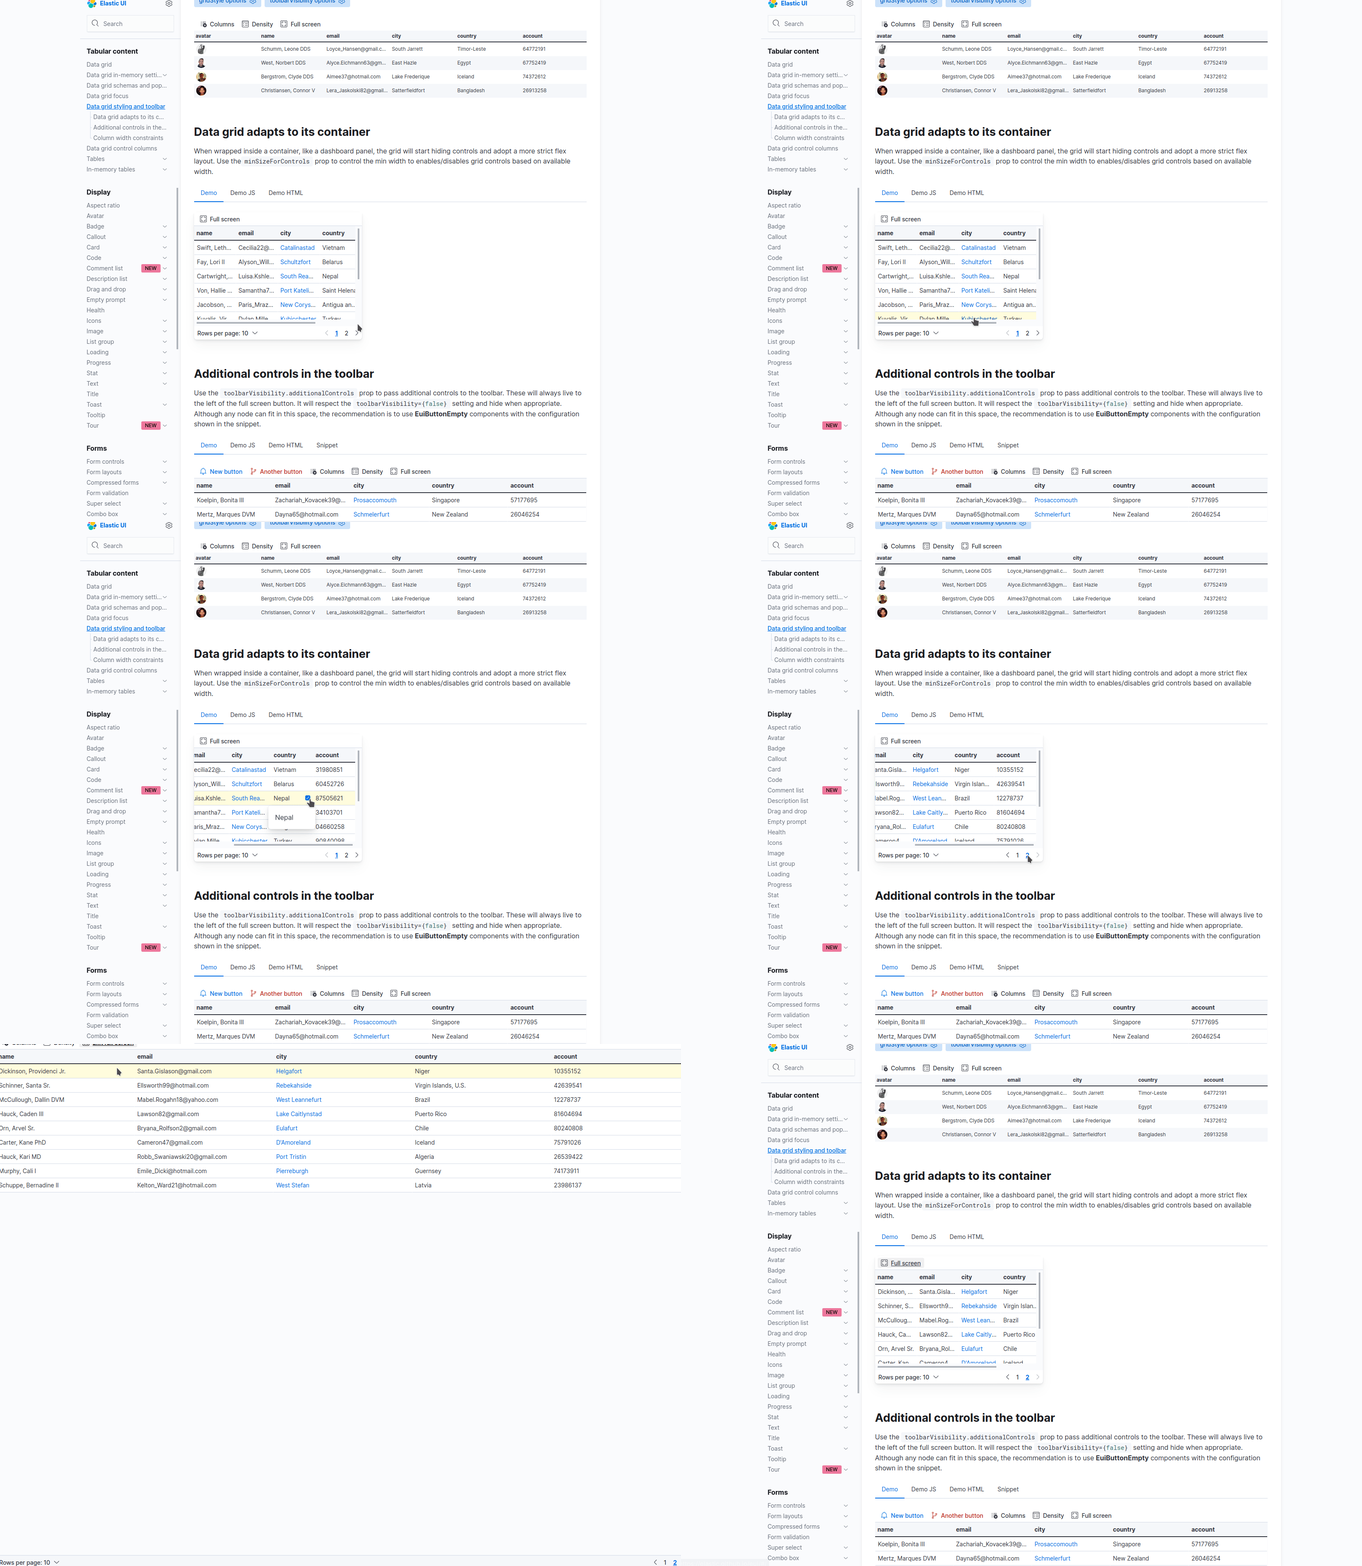
I derived this example from the screenshot you sent @snide, compared against how Visualize and Lens behave with the basic table: This screenshot shows that Visualize is actually hiding the pagination controls, while Lens doesn't use pagination at all and shows the full results in a single page which scrolls. Horizontal scrolling is done by both. |
|
Visualize and Lens are not using the same table renderer so we can't bucket them into the same column for comparison against EuiDataGrid. Visualize is using the legacy The agg table (visualize) also can in fact show pagination, which it does by default. Users have to turn pagination off manually. |
|
In that format this is how I'd write it up. There are also some soft comparisons I think need to be considered here. For one, EuiTables are considered mostly feature complete and we are unlikely to add more to it, since they are on purpose built to be simple displays for CRUD interfaces. DataGrid is meant more to be an Excel-like experience, so most of these wants are more compatible with that interface and are likely to be added over time.
|
|
Nice! I see a copy/paste happening soon into EUI docs of this comparison table... 😆 I updated the column headers to be explicit about that we are comparing EUI table components and not implementations of tables in Kibana. |
|
The main conclusion I'm seeing here is that we should transition to DataGrid. Going to change this from a discussion to tech debt. |
|
Do we need to do it for Lens default? |
|
@AlonaNadler My opinion is that this is not needed for Lens by default because this is an incremental improvement. The only table-related feature we have for Lens by default is the ability to sort the columns, and that's something that can be done with both tables. |


Edit: Discussion concluded and this is now a recommended improvement that is not really a new feature, but tech debt we should tackle
The current Lens table implementation is very simple and supports no interactivity or custom styling. There are three elements to the discussion of replacing the Lens table with a more powerful table:
Unless there is a strong reason to use the data grid in one of these categories, Lens should not switch.
Product requirements that might need to be supported
Based on the table features for Lens:
The main difference is therefore support for changing column width, reordering columns, and subtotal rows.
Technical requirements
The EuiDataGrid must be performant and stable before we switch.
Consistency across Kibana
Currently, the EuiBasicTable is used in every table visualization that can be embedded in a dashboard, except for the upcoming Discover implementation. If we make a change only in Lens, will this introduce inconsistency?
Conclusion
Based on this analysis of the requirements for Lens tables, I do not think that the benefits outweigh the costs of switching.
cc @elastic/eui-design
The text was updated successfully, but these errors were encountered: