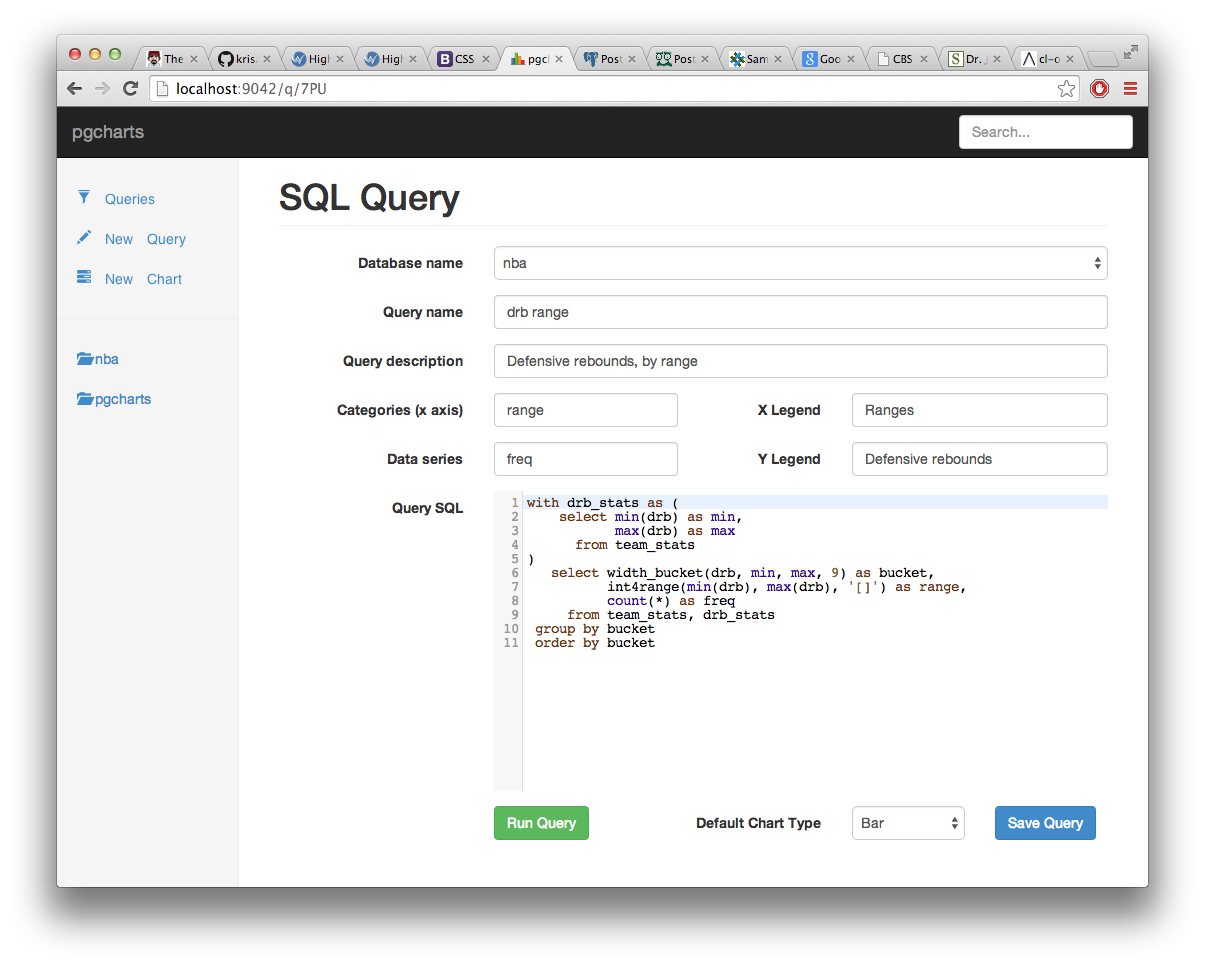
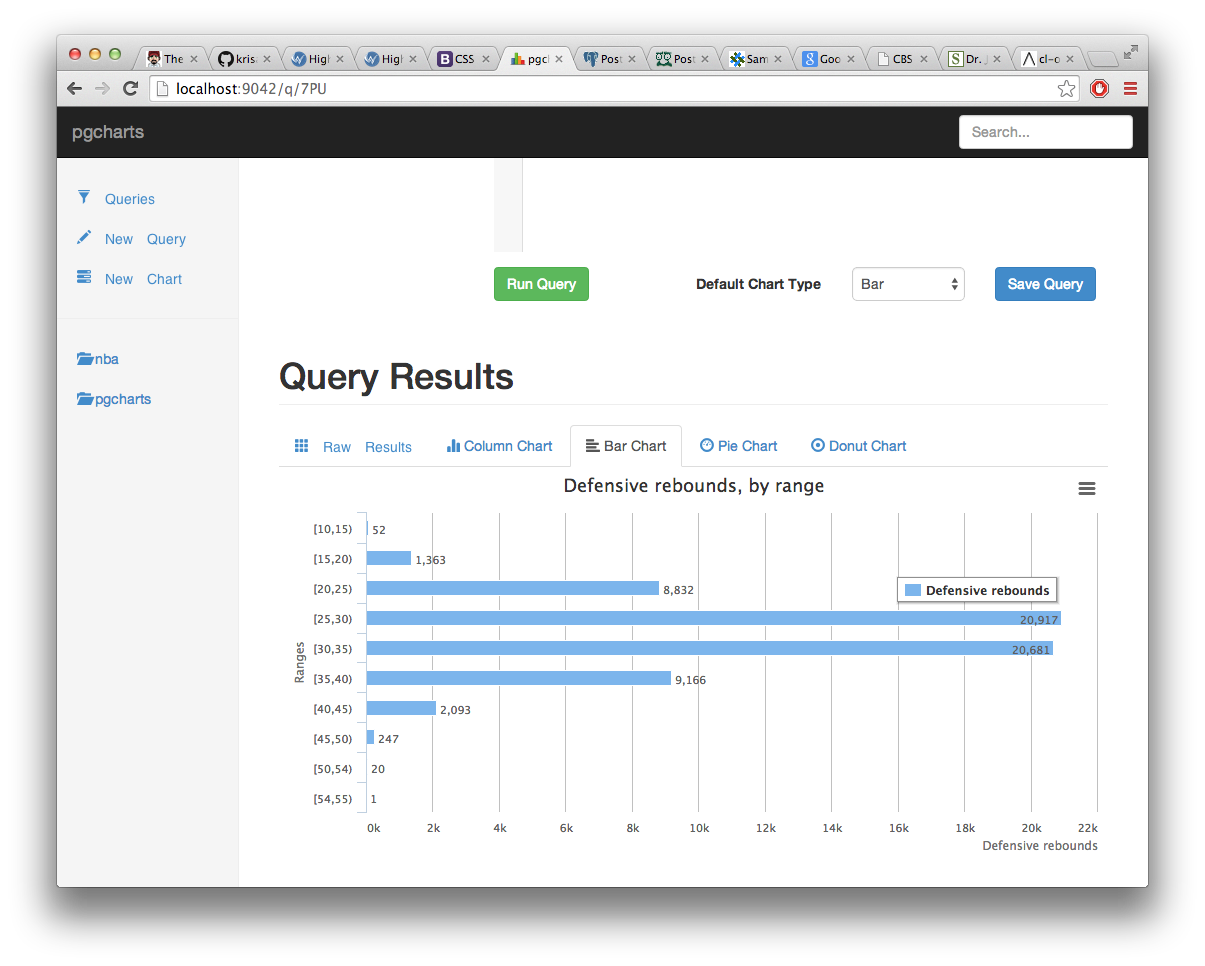
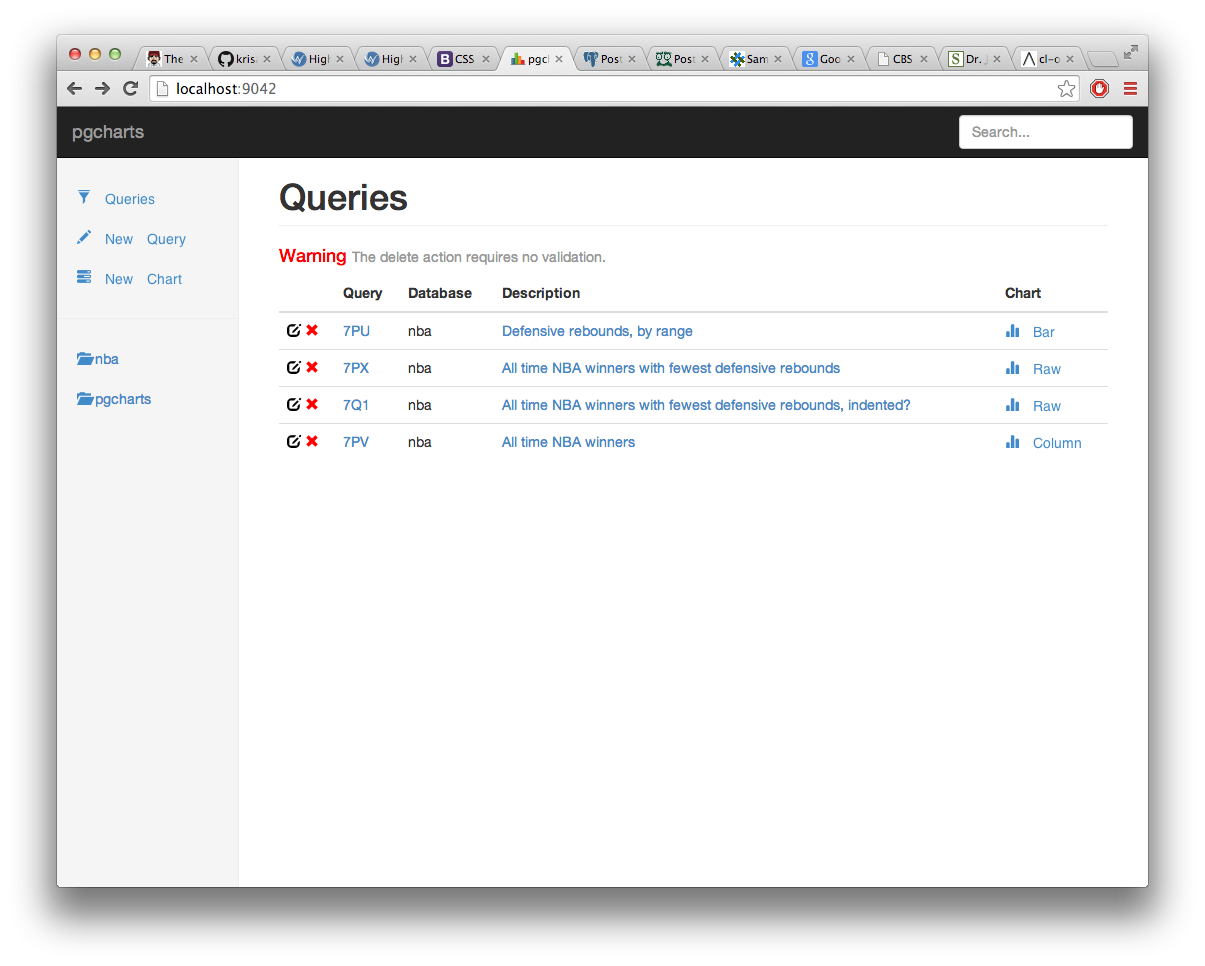
It's intended as a visual project. Here's what it looks like.
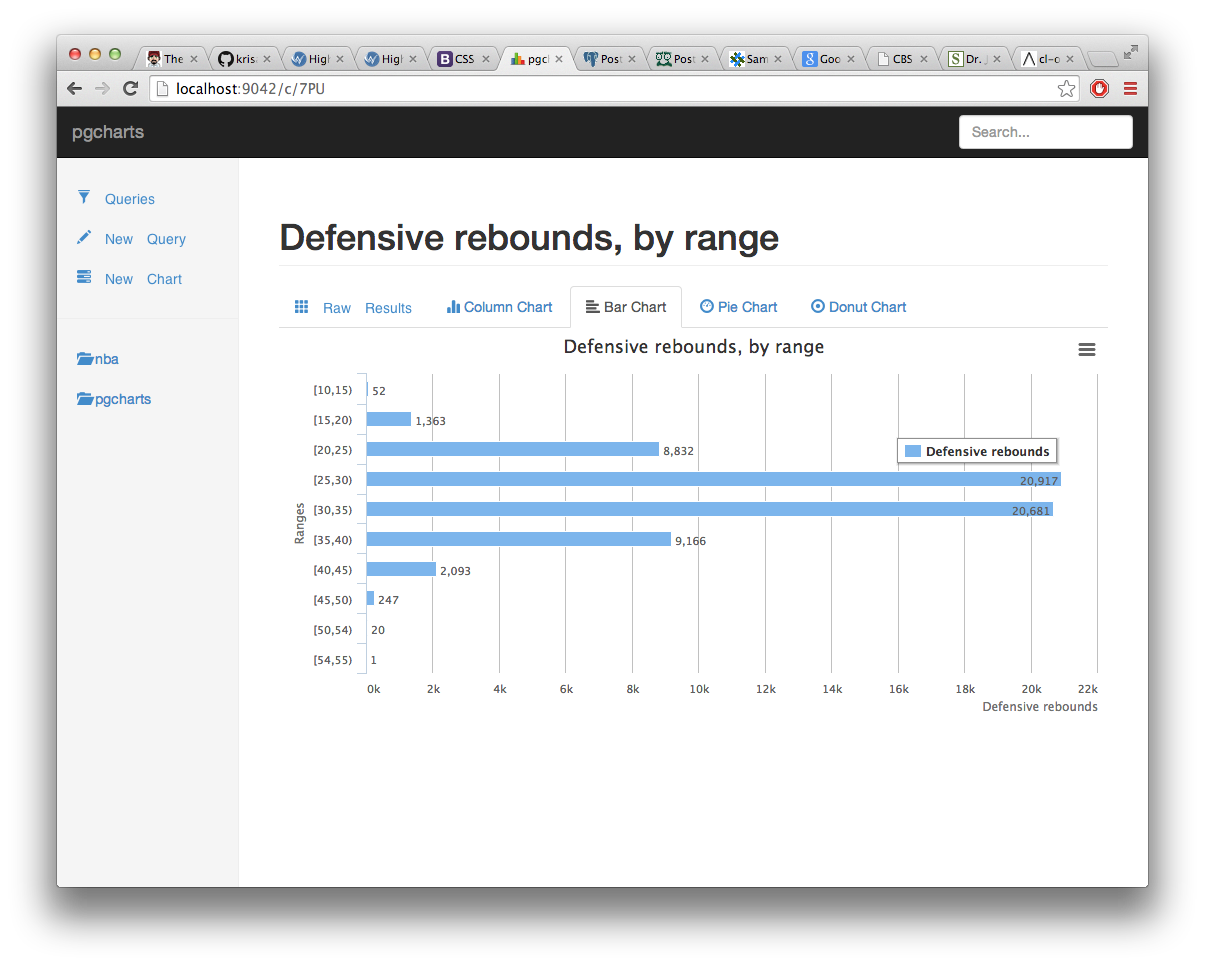
So that you can give an URL to just the chart for your coworkers to see (and download as a PDF, PNG, JPEG or SVG document):
The pgcharts projects is a little web application that takes as input an SQL query text and outputs its data in one of the following forms:
- HTML table
- Column Chart
- Bar Chart
- Pie Chart
- Donut Chart
With more to come (TODO):
- Area Chart
- Line Chart
- Stacked Area Chart
- Stacked Bar Chart
- Grouped Bar Chart
- CSV file
The pgcharts application needs its own PostgreSQL database to be able to register user queries and their charts setup:
$ createdb pgcharts
$ pgcharts setup pgsql://localhost/pgcharts
Then you can start the service, which defaults to listening to http://localhost:9042/:
$ pgcharts start
$ open http://localhost:9042/
Now, you can use pgcharts from your browser. Issue new query, save them away, and see nice charts from their results!
Once the pgcharts database has been created, it's necessary to register the database servers you want to run queries against:
$ pgcharts register pgsql://user:pass@host/dbname
$ pgcharts register pgsql://user:pass@host/seconddbname?sslmode=require
The sslmode option accepts the following values: disable, allow,
prefer and require. The allow and prefer options are implements in
the same way, translating to the
Postmodern
PostgreSQL driver's value :try, where :try means if the server supports
it.
pgchart needs a database where to handle its own data, as it is storing a list of database connections (where to run the queries) and a list of queries (with a name and a tags list).
TODO: see about storing query results on the pgcharts database so that it's possible to get back to them later. Maybe with some ways to run the query again and compare?
The pgcharts web service offers no security implementation, no user role management or privileges. To keep the service secure, users are only allowed to query against registered database servers.
To register a database server to pgcharts, the command line interface must be used, so only the service administrator is in a position to register new database servers.
pgcharts is a self-contained web application. As such, when you start the command line application, it starts its own web server that you can connect to.
The pgcharts application has been written in Common Lisp and uses a bunch
of librairies that are available through the Quicklisp distribution
system. The included Makefile cares about building a self-contained binary
for you, and can be used as following:
$ <install recent sbcl>
$ make
$ ./build/bin/pgcharts --help
Note that the self-contained binary also includes static web resources such as jquery, bootstrap, Highcharts and codemirror.
You need a recent enough SBCL Common Lisp compiler to be able to compile pgcharts. It's easy to install on Linux, MacOSX and Windows.
debian$ sudo apt-get install sbcl
centos$ sudo yum install sbcl
macosx$ brew install sbcl


