-
Notifications
You must be signed in to change notification settings - Fork 358
New issue
Have a question about this project? Sign up for a free GitHub account to open an issue and contact its maintainers and the community.
By clicking “Sign up for GitHub”, you agree to our terms of service and privacy statement. We’ll occasionally send you account related emails.
Already on GitHub? Sign in to your account
ENH: Add area plot for DataFrame #696
ENH: Add area plot for DataFrame #696
Conversation
| Returns | ||
| ------- | ||
| matplotlib.axes.Axes or numpy.ndarray | ||
| Area plot, or array of area plots if subplots is True. |
There was a problem hiding this comment.
Choose a reason for hiding this comment
The reason will be displayed to describe this comment to others. Learn more.
@charlesdong1991, after you finish to add all plots, mind cleaning those documentation to have some examples in a separate PR later? It would be great if we do it in Seres's too together.
There was a problem hiding this comment.
Choose a reason for hiding this comment
The reason will be displayed to describe this comment to others. Learn more.
yeah, honestly I was thinking of doing so :) once most of plots are finished, I will create a separate PR to fix them all for Series and DataFrame. I will focus on plot implementation for now.
Does it sound good to you? @HyukjinKwon
There was a problem hiding this comment.
Choose a reason for hiding this comment
The reason will be displayed to describe this comment to others. Learn more.
Yea, plase!
There was a problem hiding this comment.
Choose a reason for hiding this comment
The reason will be displayed to describe this comment to others. Learn more.
Looks fine. Let me double check tomorrow and merge.
Codecov Report
@@           Coverage Diff           @@
##           master     #696   +/-   ##
=======================================
  Coverage   93.87%   93.87%
=======================================
  Files          32       32
  Lines        5548     5548
=======================================
  Hits         5208     5208
  Misses        340      340
Continue to review full report at Codecov.
|
|
@charlesdong1991, mind resolving conflicts? |
|
yeah, resolved. @HyukjinKwon |
|
i will resolve the conflict first, and test the examples used on Pandas to make sure the implementation is correct... I will ping when this PR is ready... @HyukjinKwon |
|
Oops, yes. please resolve conflicts. I will merge. |
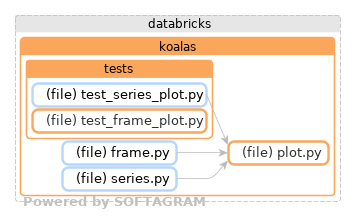
Softagram Impact Report for pull/696 (head commit: 496e639)⭐ Change Overview
📄 Full report
Give feedback on this report to [email protected] |
|
looks good with pandas plot example: works good with y specified: works also good with stacked=False i also added tests for the latter two cases in tests to prove they all work correctly. @HyukjinKwon |
|
nice! |


kdf plot:
pdf plot: