1 Centre of Excellence for Biosecurity Risk Analysis, 2 School of BioSciences, University of Melbourne, Parkville, Melbourne, 3010, Australia
doi:
🔗 Malishev M, Michael Bull C, Kearney MR. An individual‐based model of ectotherm movement integrating metabolic and microclimatic constraints. Methods Ecol Evol. 2018;9:472–489.
Versions:
- R 3.5.0
- RStudio 1.1.453
- JGR 3.4.1
- Netlogo 5.3.1
File extensions:
.R
.Rmd
.nlogo
.csv
.pdf
.rtf
.html
- An understanding of the direct links between animals and their environment can offer insights into the drivers and constraints to animal movement. Constraints on movement interact in complex ways with the physiology of the animal (metabolism) and physical environment (food and weather), but can be modelled using physical principles of energy and mass exchange. Here, we describe a general, spatially explicit individual-based movement model that couples a nutritional energy and mass budget model [Dynamic Energy Budget (DEB) theory] with a biophysical model of heat exchange. This provides a highly integrated method for constraining an ectothermic animal’s movement in response to how food and microclimates vary in space and time.
- The model uses R to drive a NetLogo individual-based model together with microclimate and energy- and mass-budget modelling functions from the R package ‘NicheMapR’. It explicitly incorporates physiological and morphological traits, behavioural thermoregulation, movement strategies, and movement costs. From this, the model generates activity budgets of foraging and shade-seeking, home range behaviour, spatial movement patterns, and life history consequences under user-defined configurations of food and microclimates. To illustrate the model, we run simulations of the Australian sleepy lizard Tiliqua rugosa under different movement strategies (optimising or satisficing) in two contrasting habitats of varying food and shade (sparse and dense). We then compare the results with real, fine-scale movement data of a wild population throughout the breeding season.
- Our results show that 1) the extremes of movement behaviour observed in sleepy lizards are consistent with feeding requirements (passive movement) and thermal constraints (active movement), 2) the model realistically captures majority of the distribution of observed home range size, 3) both satisficing and optimising movement strategies appear to exist in the wild population, but home range size more closely approximates an optimising strategy, and 4) satisficing was more energetically efficient than optimising movement, which returned no additional benefit in metabolic fitness outputs.
- This framework for predicting physical constraints to individual movement can be extended to individual-level interactions with the same or different species and provides new capabilities for forecasting future responses to novel resource and weather scenarios.
** Keywords:** biophysical ecology, dynamic energy budget, individual-based model, microclimate, movement ecology, spatial, thermoregulation
Where do Animals Spend Their Time and Energy? Theory, Simulations and GPS Trackers Can Help Us Find Out, Methods Blog, May 22, 2019.
British Ecological Society Robert May Prize 2018 shorlisted article
- Predicting how habitat constraints change across life stage
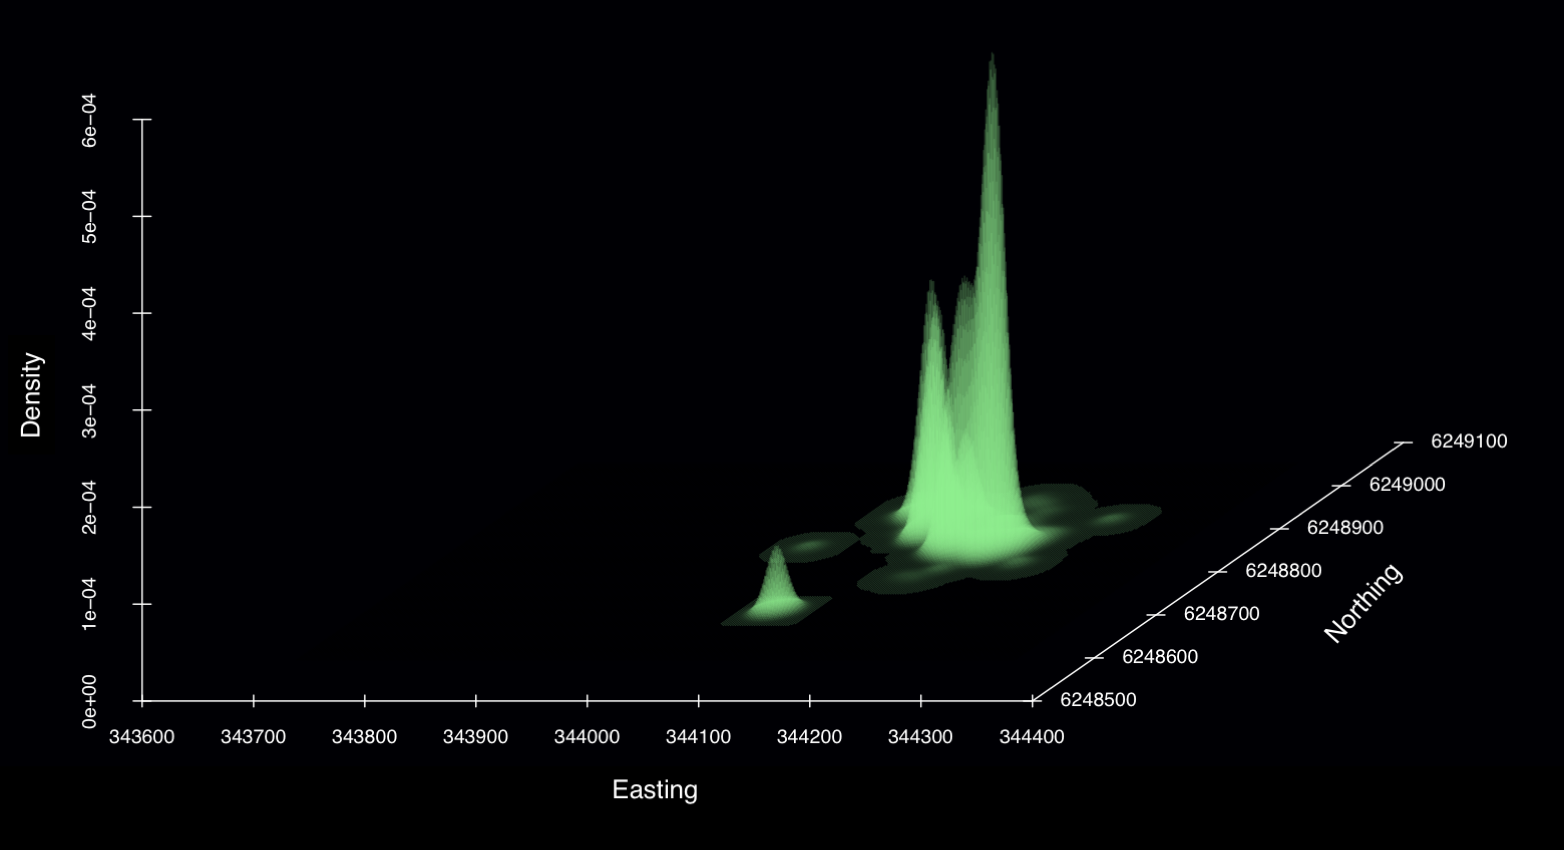
- Representing geolocation data in 3D space to show limits to dispersal and residence times in space
Running JGR and the rJava package in R for Mac OSX El Capitan 10.11.+ is specified in the R model file. If problems persist, feel free to contact me at matthew.malishev [at] gmail.com
For Mac OSX > 10 (El Capitan):
1️⃣ Override user access to java system files (see https://stackoverflow.com/questions/30738974/rjava-load-error-in-rstudio-r-after-upgrading-to-osx-yosemite)
sudo ln -s $(/usr/libexec/java_home)/jre/lib/server/libjvm.dylib /usr/local/lib
2️⃣ Install RNetLogo and rJava packages from source
3️⃣ Open and run JGR to run model simulation
This model is optimised to run on Netlogo 5.3.1.
Matt Malishev
🔍 Website
🐦 @darwinanddavis
📧 matthew.malishev [at] gmail.com

