Find correlation between genomic features (like SNPs, methylation, TFBS) and functional genomic regions in different genomes
- Plot sequence features such as TFBS, SNPs, methylation, RNA-seq coverage
- Map it on functional genomic regions
- Find correlation and check reproducibility for different genomes
- Consider annotation quality and outcomes for functional features (like promoters)prediction for not annotated genomes
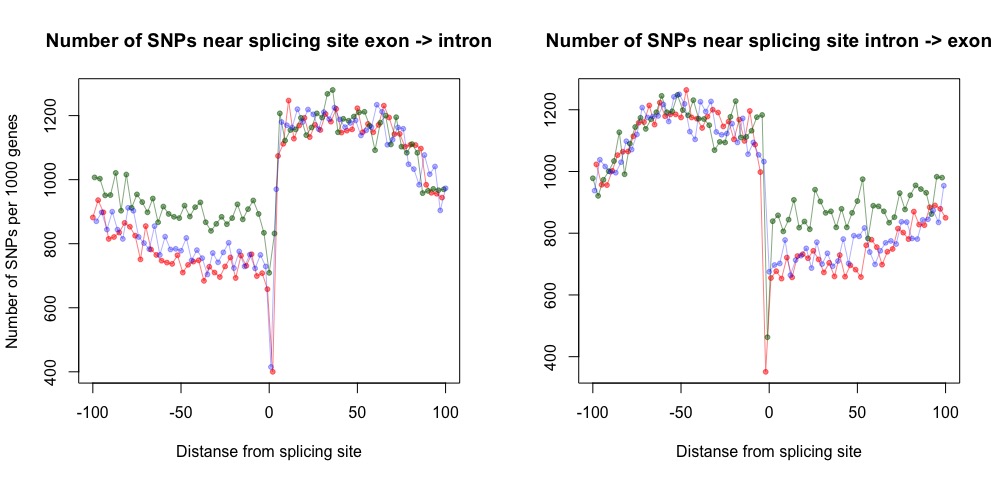
Graphs for Oryza sativa [1]
- reference genome TAIR10_toplevel (ftp://ftp.ensemblgenomes.org/pub/plants/release-39/fasta/arabidopsis_thaliana/dna/)
- annotation TAIR10_GFF3_genes.gff3
- variation vcf file 1001 genome TAIR
- methylation data
- annotation (.gff) and assemly (.fasta) from http://www.medicagogenome.org/downloads
- SNP files also from http://www.medicagogenome.org/downloads
- annotation Release 28 (GRCh38.p12) (CHR) in .gff3 format
- .fasta of primary assembly (PRI)
- annotation Release M17 (GRCm38.p6) (CHR) in .gff3 format
- .fasta of primary assembly (PRI)
- annotation assembly Felis_catus_9.0 in .gff format (ID 78)
- .fasta of assembly 9.0 (ID 78)
- reference assembly dmel_r5.57_FB2014_03 from FlyBase, dmel-all-chromosome-r5.57.fasta.gz
- annotation dmel_r5.57_FB2014_03 dmel-all-filtered-r5.57.gff.gz
- variation downloaded for each chromosome for all populations in one file in .vcf formatPopFly Browser Hervas S, Sanz E, Casillas S, Pool JE, and Barbadilla A (2017) PopFly: the Drosophila population genomics browser. Bioinformatics, 33, 2779-2780;
- get_ATGs.py
- get_4tss.py
- get_4tts.py
- get_promoters.py
- get_fin_anno.py
- to create file with ATGs:
python3 get_ATGs.py annotation.gff - to create file with tss:
python3 get_4tss.py annotation.gff - to create files with promoter regions (.bed + .txt):
python3 get_promoters.py 4tss.txt - to obtain promoter regions sequences:
sed 's/^>1.*$/>Chr1/' Arabidopsis_thaliana.TAIR10.dna.toplevel.fa | sed 's/^>2.*$/>Chr2/' | sed 's/^>3.*$/>Chr3/'| sed 's/^>4.*$/>Chr4/'| sed 's/^>5.*$/>Chr5/'| sed 's/^>Mt.*$/>ChrM/'| sed 's/^>Pt.*$/>ChrC/' > new_ref.fain order to get names of chromosomes in fasta consistent with names in bed file, thenbedtools getfasta -fi corrected_reference.fasta -bed promoters.bed -name -s -fo promoters_sequences.fasta - to create fin_anno:
python3 get_fin_anno.py annotation.gff
- first (and the most important) file is snp_custom_annotation.r, which contains a function that create custom annotation of snps - all other scripts use these function
- ATG_plot.r is used for visualization SNP distribution around start codon (required packages are dplyr, scales)
- intron_exon_junctions.r is used for visualization of SNP distribution around exon-intron boundary
- promoter-terminator.r is used for visualization of SNP distribution around terminator
- transcr_stop_plot.r is used for visualization of SNP distribution around transcription stop codon
- transfac.r is used for visualization distribution of TFBSs in promoter region (+-500 nucleotides around TSS)


