-
Notifications
You must be signed in to change notification settings - Fork 8
Introduction to Time Series Analysis

In mathematics, a time series is a series of data points indexed in time order. Most commonly, a time series is a sequence taken at successive equally spaced points in time. Thus it is a sequence of discrete-time data. Examples of time series are heights of ocean tides, counts of sunspots, and the daily closing value of the Dow Jones Industrial Average.
A time series is very frequently plotted via a run chart (which is a temporal line chart). Time series are used in statistics, signal processing, pattern recognition, econometrics, mathematical finance, weather forecasting, earthquake prediction, electroencephalography, control engineering, astronomy, communications engineering, and largely in any domain of applied science and engineering which involves temporal measurements.
Time series analysis comprises methods for analyzing time series data in order to extract meaningful statistics and other characteristics of the data. Time series forecasting is the use of a model to predict future values based on previously observed values.
Before we begin describing time series, we describe a list of basic concepts:
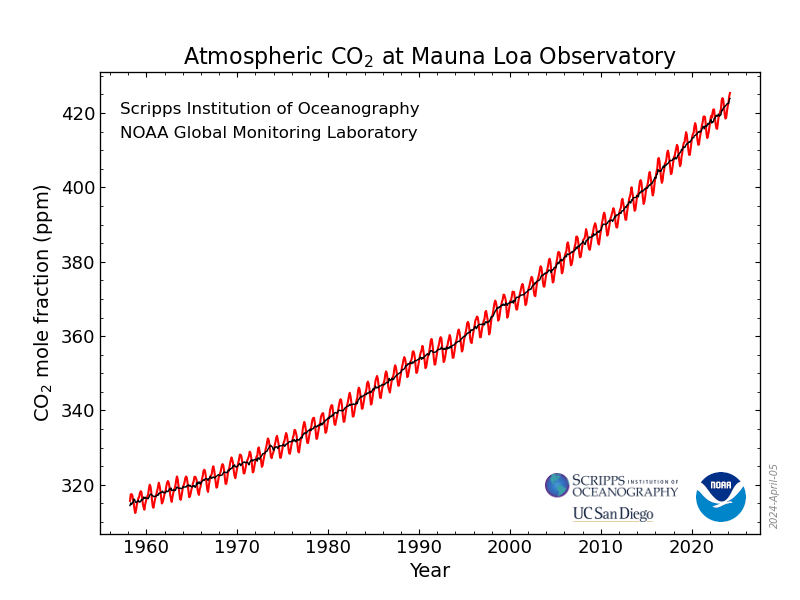
- Trend: It refers to whether data values increase or decrease with time.
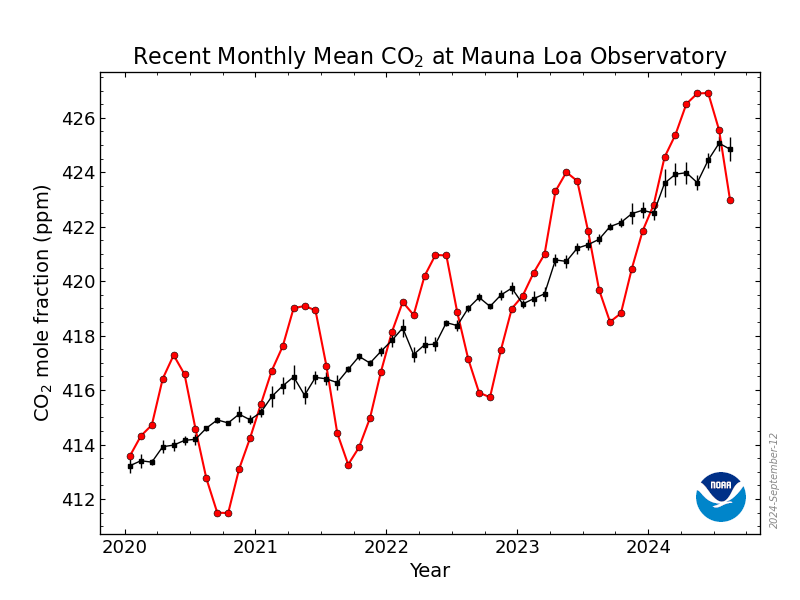
- Seasonality and cycles: Seasonality is a repeated behavior of data that occurs on the regular interval of time. It means that there are patterns that repeat themselves after some interval of the period then we call it seasonality.
The difference between seasonality and cycles is that seasonality is always has a fixed and a known frequency. The cycles also have rise and fall peaks but not a fixed frequency. The Solar cycle duration is nearly 11 years.
-
Variations and Irregularities. The variation and irregular patterns are not fixed frequency patterns and they are or short duration and non-repeating.
-
Stationary and Non-Stationary. A stationary process has the property that the mean, variance and autocorrelation structure do not change over time.

If the series is not stationary then we make the data to be stationary with some method or test.
Rolling Statistics and Dickey-Fuller Test.
These two tests are performed to check the stationarity of the time series.
The Rolling statistics is that we check of moving average and moving variance of the series that it varies with time or not. It is a kind of visual type test result.
The Dickey-Fuller test is a type of hypothesis test in which the test statistic value is smaller than the p-value then we will reject the null hypothesis. The null hypothesis in this is time series is non-stationary.
- Understand Time Series Components with Python. Amit Chauhan. Towards AI, Medium.
Created: 03/17/2023 (C. Lizárraga); Last update: 03/18/2023 (C. Lizárraga)
University of Arizona, D7 Data Science Institute, 2022.
- Introduction to the Command Line Interface Shell
- Unix Shell - Command Line Programming
- Introduction to Github Wikis
- Introduction to Github
- Github Wikis and Github Pages
- Introduction to Docker
- Introduction to Python for Data Science - RezBaz AZ 2022.
- Jupyter Notebooks
- Pandas for Data Analysis
- Exploratory Data Analysis with Python
- Low-code Data Exploration Tools
- Outlier Analysis and Anomalies Detection.
- Data Visualization with Python
- Introduction to Time Series Analysis
- Low-code Time Series Analysis
- Time Series Forecasting
- Overview of Machine Learning Algorithms
- Overview of Deep Learning Algorithms
- Introduction to Machine Learning with Scikit-Learn
Carlos Lizárraga, Data Lab, Data Science Institute, University of Arizona.


