-
Notifications
You must be signed in to change notification settings - Fork 0
Views
From the Dashboard, Views allow to monitor supervisors and administer resources through Widgets.
[[TOC]]
Content shown in Canopsis can be customised. Widgets can be added, removed and modified. To achieve this, new Views need to be created. From the Canopsis menu bar click on Run > Views manager. Figure 1 and 2 below shows how to open the Views manager.
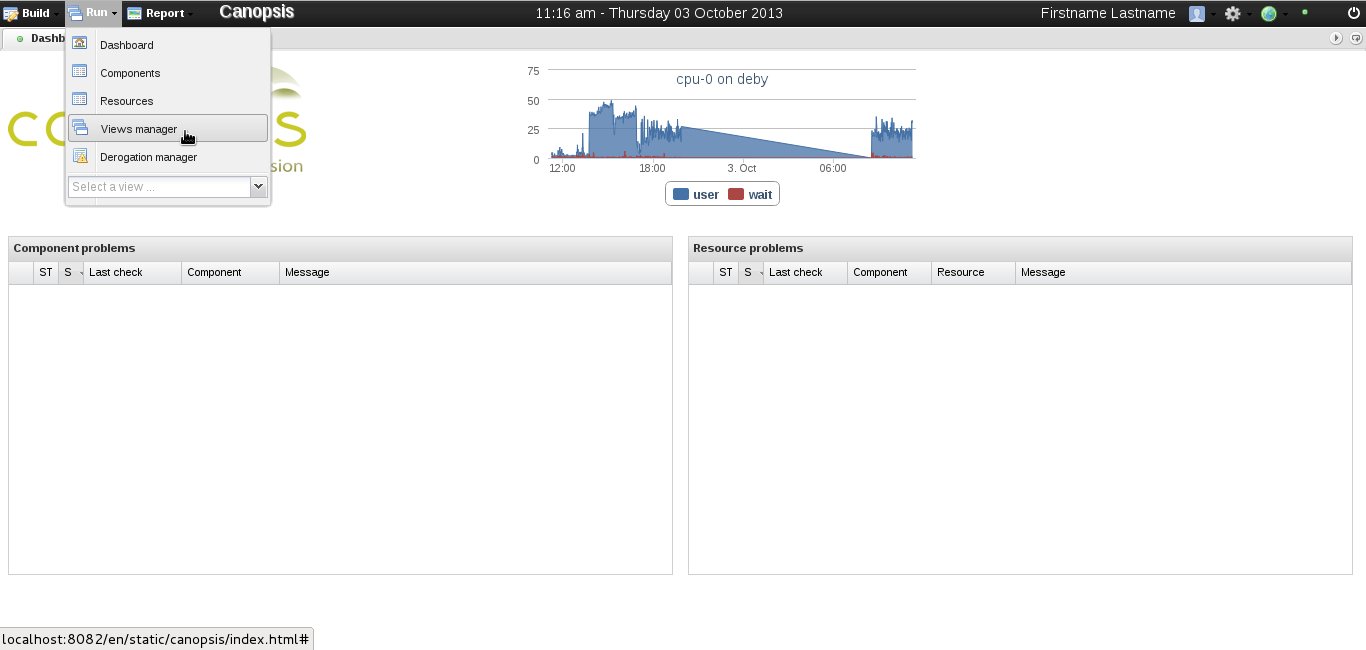 figure 1 |
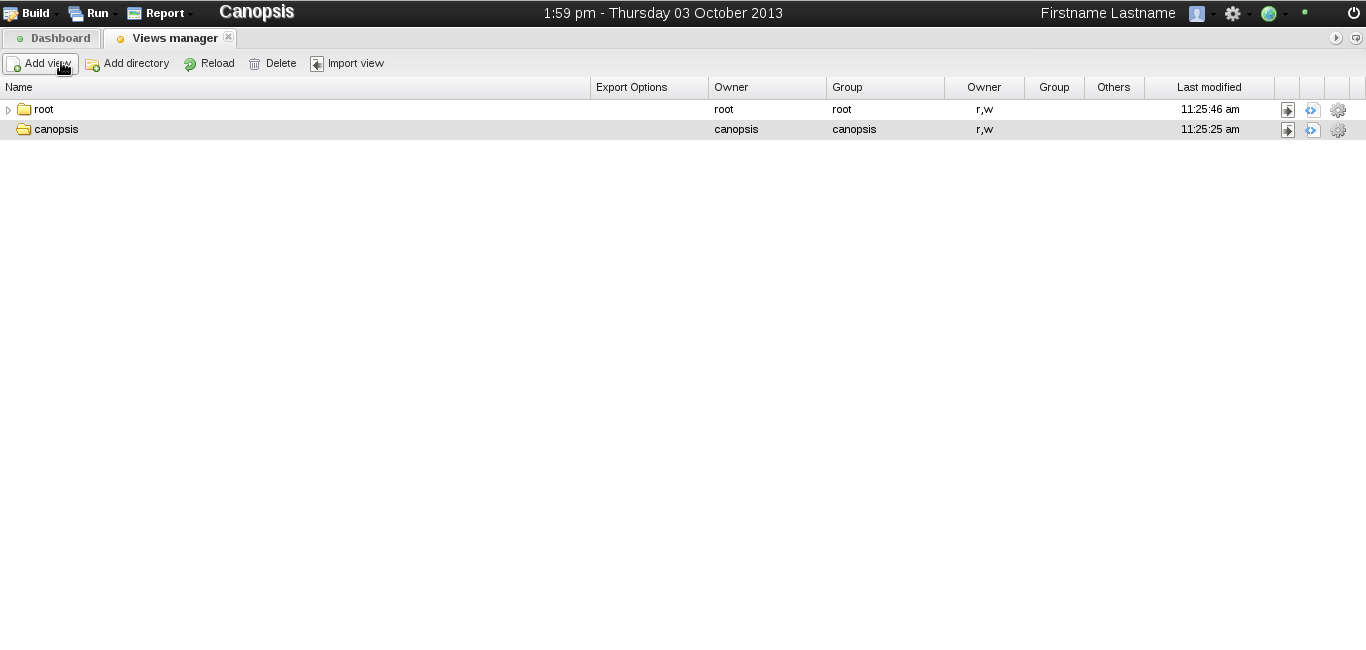 figure 2 |
Once in Views manager click on the "Add view" button in the toolbar, a dialog window should popup, fill in a name for the new view (see Fig 3).
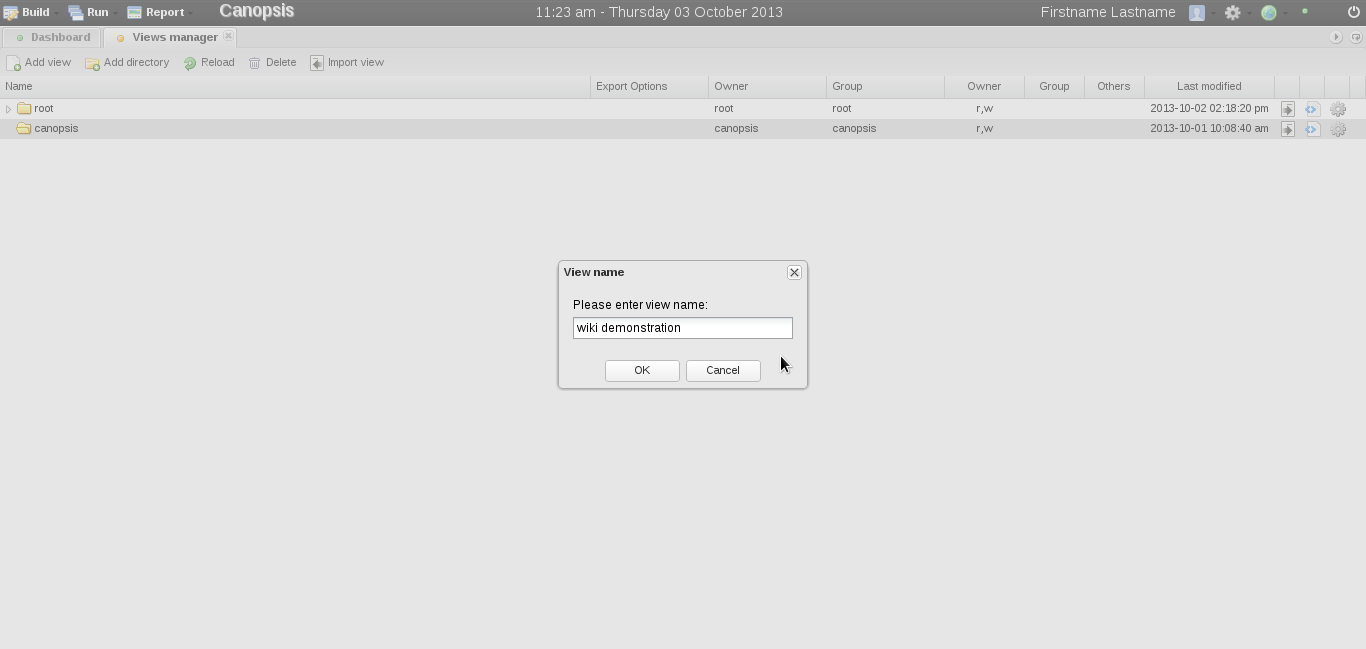 figure 3 |
Once you click Ok, you should enter the new view in edit mode like shown below in Figure 4. To add a new widget, with the mouse click and select an empty area over the dashboard then release the button. (see Fig 5).
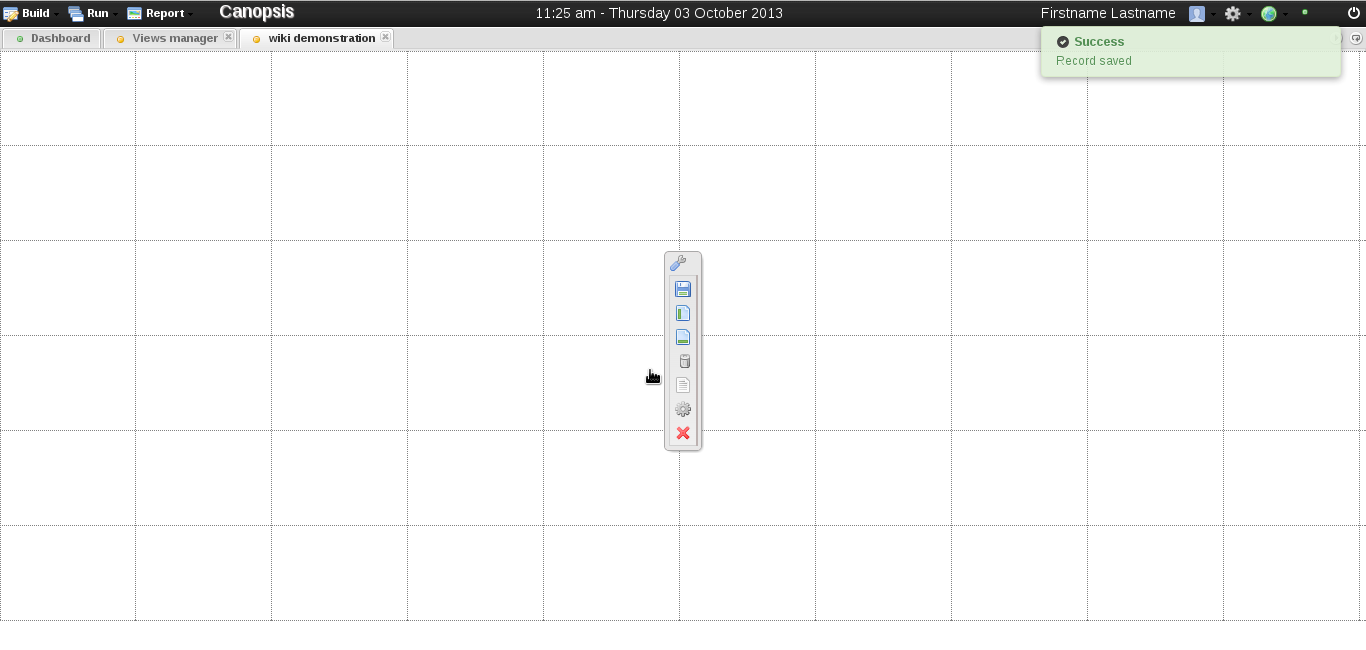 figure 4 |
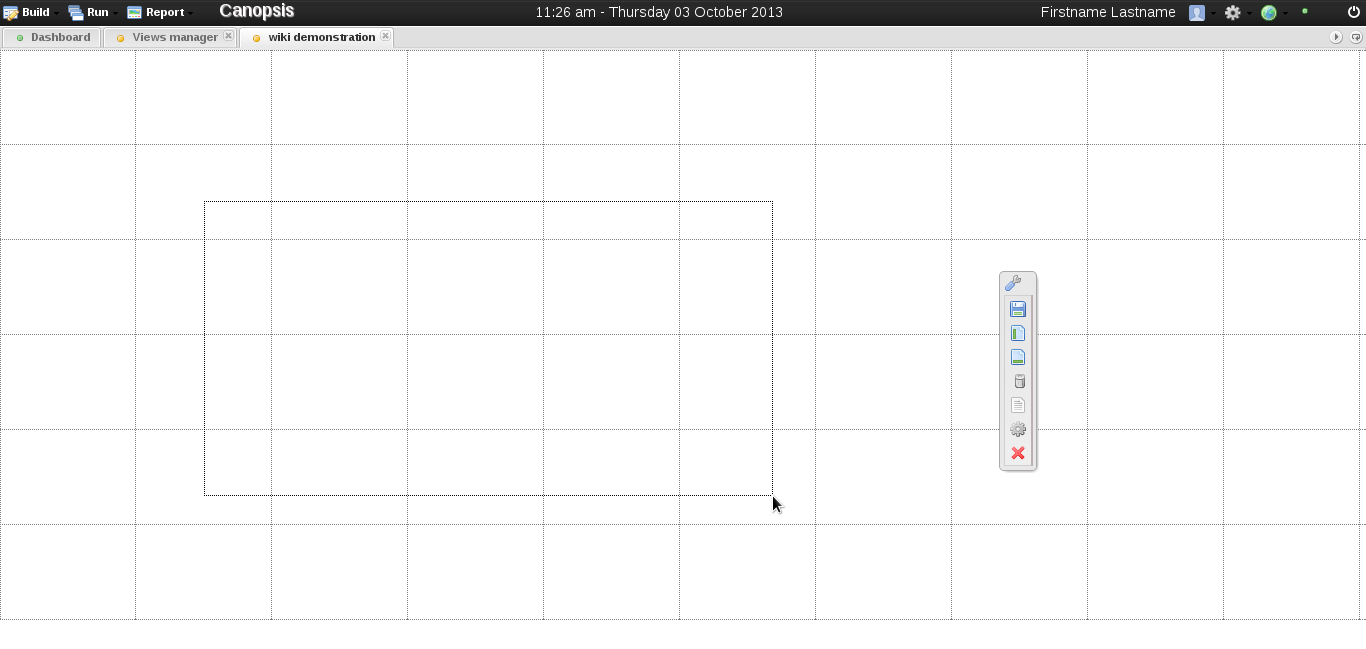 figure 5 |
Upon releasing the mouse button, a "new widget wizard" should popup and ask for the kind of widget you'd like to add. Below I show how to add a Pie widget representing sizes of data base tables. Fill in the information through normal configuration steps (see Fig 6, 7, 8 and 9) and optionally check advanced parameters such as visual properties or information details in the advanced configuration (see Fig 10). Finally, click save button on the lower right corner of the dialog (see Fig 11).
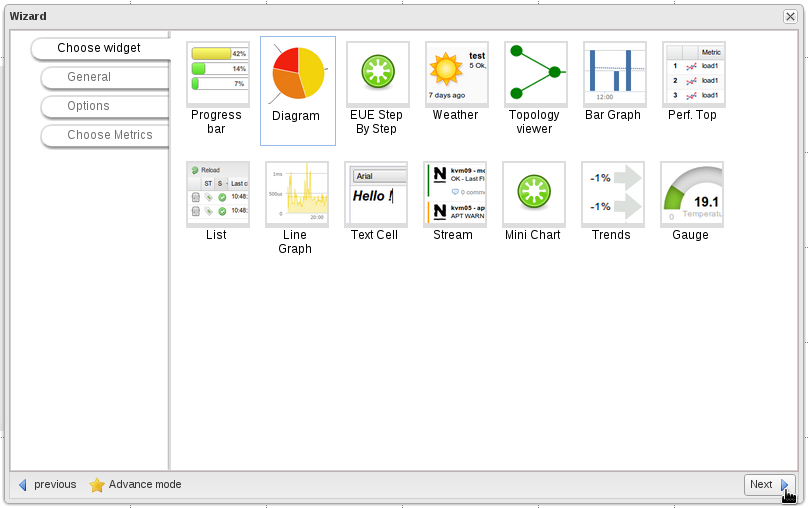 figure 6 |
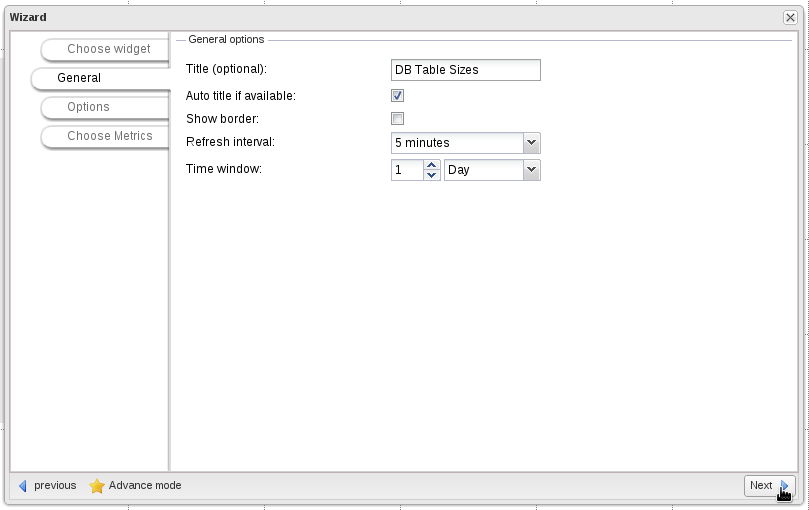 figure 7 |
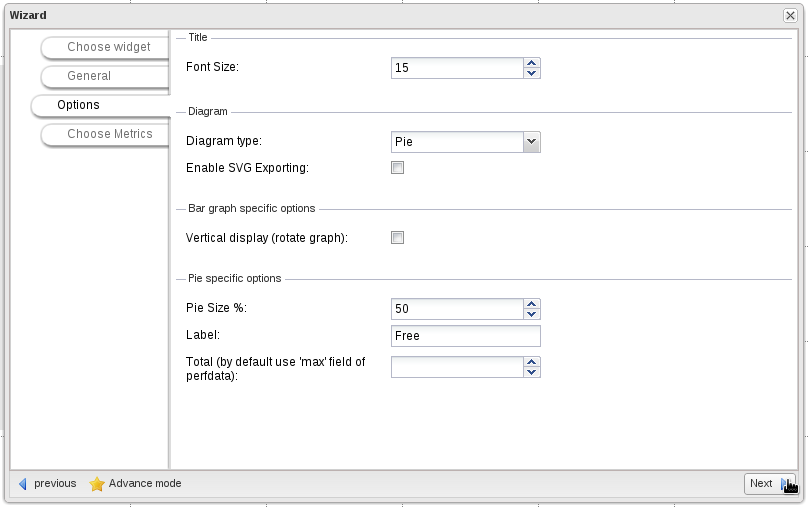 figure 8 |
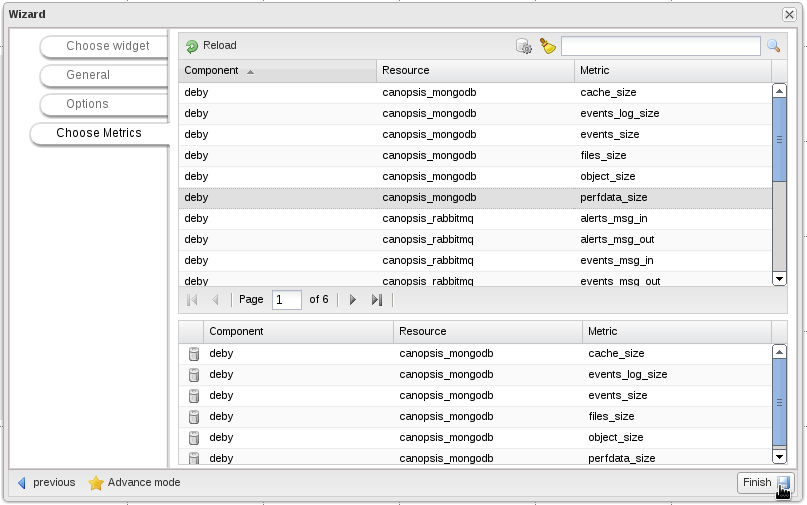 figure 9 |
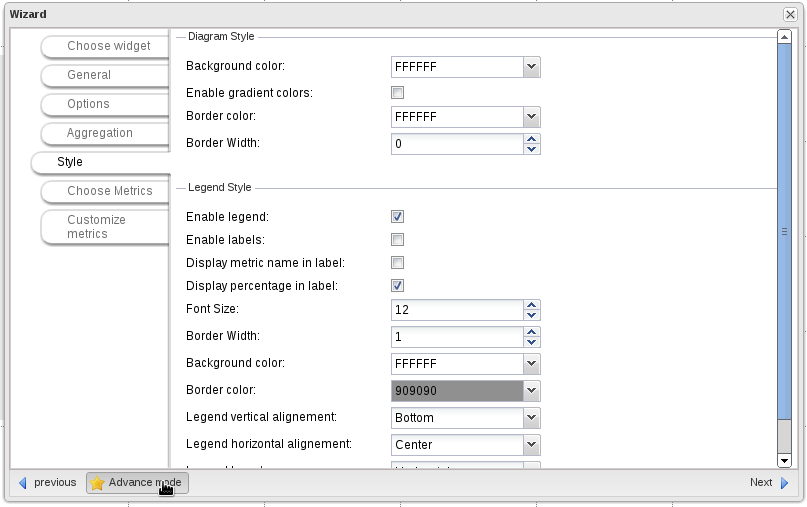 figure 10 |
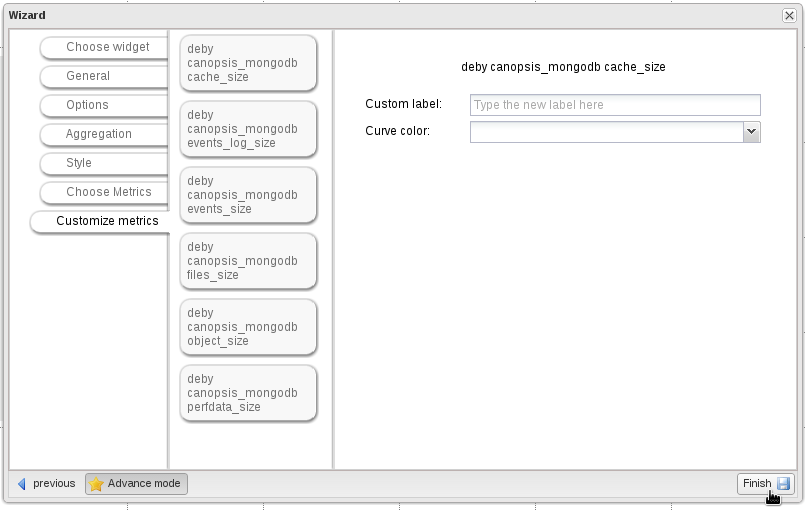 figure 11 |
Figure 12 shows the result: a new pie chart widget representing sizes of data base tables. You can modify, duplicate or delete it by pressing the secondary mouse button, or click the floppy disk icon on the floating toolbox (see Fig 13) in order to save the changes to the View so far (see Fig 14).
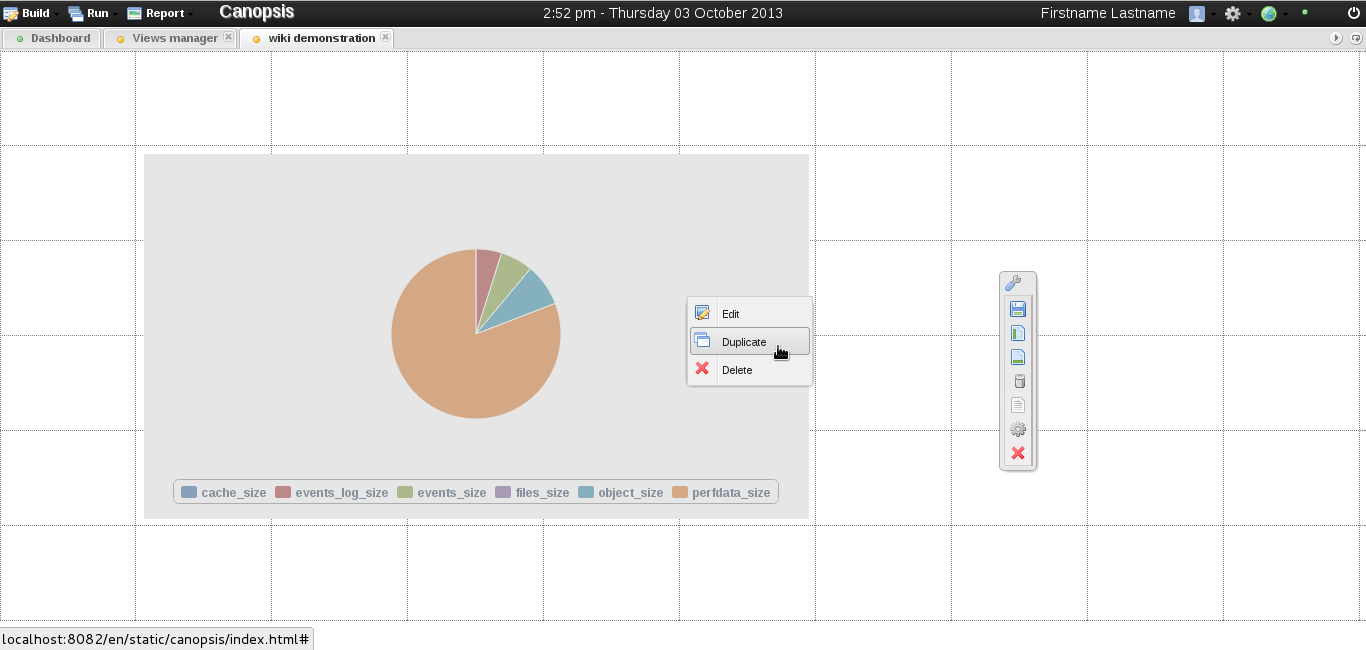 figure 12 |
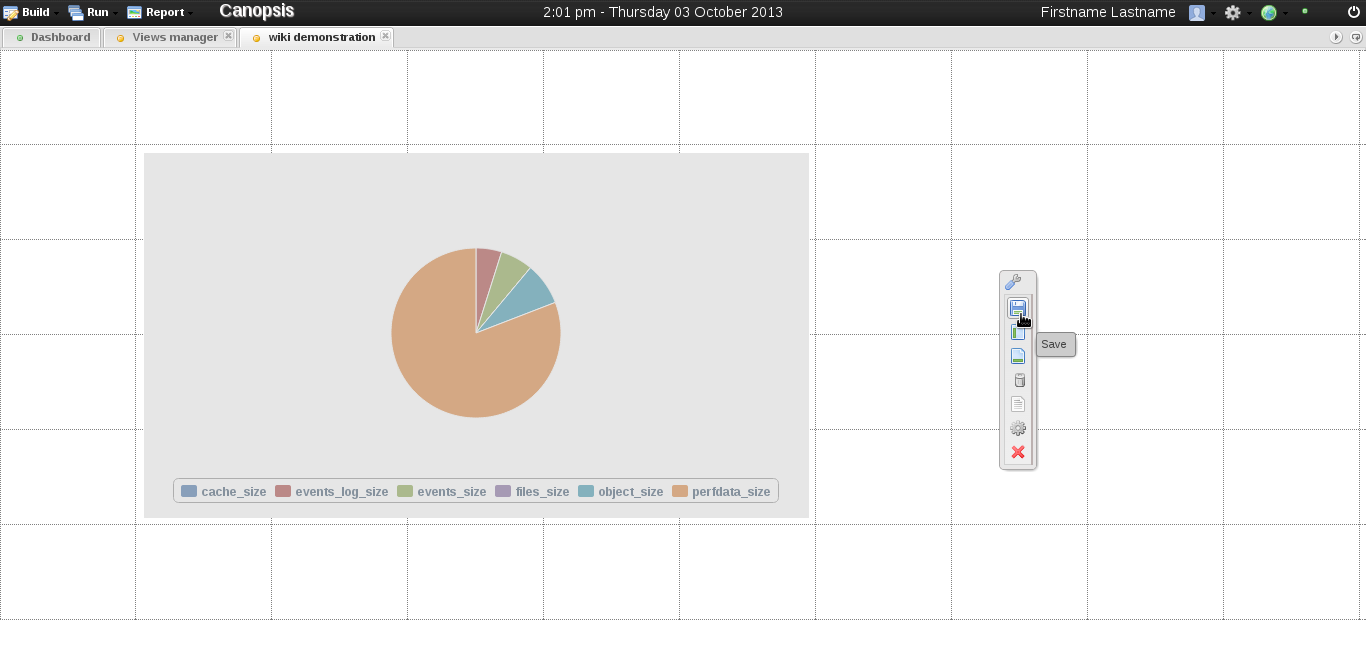 figure 13 |
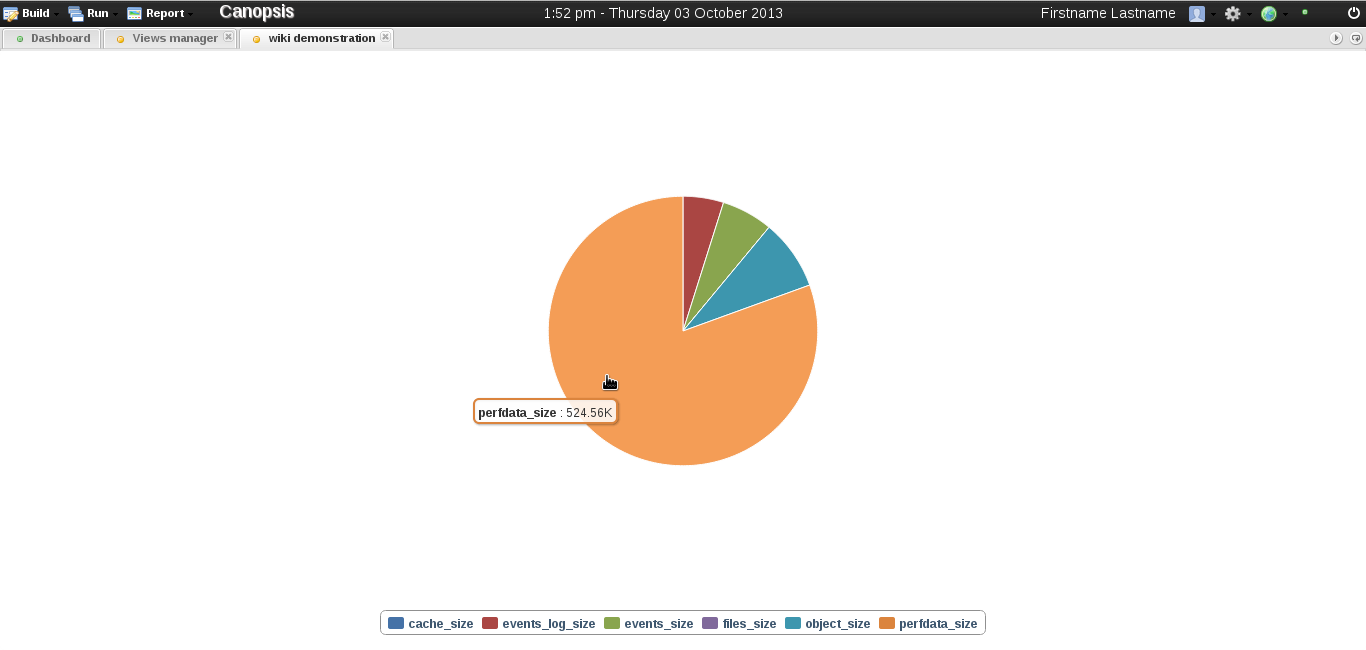 figure 14 |
In order to improve user experience, keyboard shortcuts and mouse tricks are available.
- ctrl + e = edit active view
- ctrl + s = save active view (have to be in edition mode)
- ctrl + r = refresh active view
- Hide/Show the top black part: Hide it by double clicking on it. Show it in moving the cursor at the top of the dashboard.