Render node GPU timing overlay #8067
Conversation
|
Why only refresh every second? It seems a bit slow to me. There's one issue with this, I'm not sure if it's a blocker, but the fact that it uses bevy_ui means that if a game already has a ui it can't reuse this plugin. We would need to be able to draw debug ui on top of everything including other ui nodes. One thing that would be cool in the future is to have the ability to draw shaders in a bevy_ui node which would make rendering a frametime graph really easy. |
If I refresh every frame, the numbers would move too fast to read. We can tweak how fast it refreshes, maybe it should be 0.5s. I could also make it configurable.
Is this a problem? I haven't tested it with anything that has UI already. We can probably solve this with Z-layers or camera orders or something.
Agreed. I've also seen users request this feature. |
|
Yeah, making the timing configurable does seem like the best option.
Not necessarily, but it's possible that people do weird thing with their UIs and that enabling this plugin breaks it. Or just that z-layers won't be enough. Probably not worth blocking on it though. Just something to consider for the future I guess. Wonder if we could just reserve some z-layers for internal stuff? |
|
I'm also not sure a UI display for this is the most apt approach since this is always compiled in. We may want to instead expose spans or counters to profilers instead. |
|
You could display every frame and then a sliding average as well. Or a sliding max is perhaps more interesting? |
That's basically what this PR does. It optionally allows recording GPU pass durations (not on by default), and then adds a plugin (not added by default) that lets you display the results. |
Currently it's an exponential moving average, with the UI updated every 300ms (300/16.6 ~= 18 frames @ 60fps). Maybe I should do something like the average of a 20 frame sliding window, with stddev/variance of the window alongside it? Let me know what you think. |
|
Maybe this should be moved to bevy_diagnostics under an optional feature, if that won't cause cyclic dependencies... |
| wgpu-hal = "0.16.0" | ||
| wgpu-profiler = "0.12" |
There was a problem hiding this comment.
Should we consider making this an optional dependency / putting it behind a feature flag? Deployed games generally won't need / want this.
| @@ -90,6 +90,9 @@ Install [cargo-flamegraph](https://github.com/flamegraph-rs/flamegraph), [enable | |||
| After closing your app, an interactive `svg` file will be produced: | |||
| 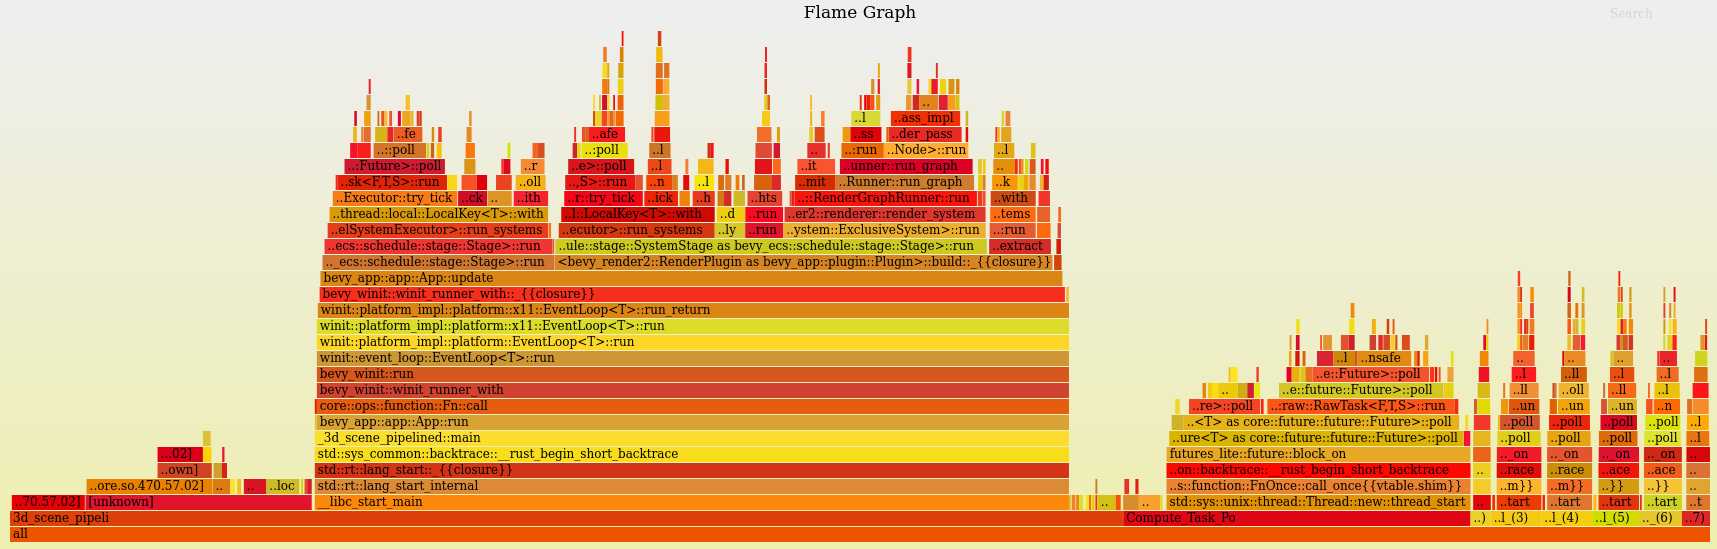 | |||
|
|
|||
| ## DebugOverlaysPlugin | |||
| TODO | |||
There was a problem hiding this comment.
This should have a quick blurb before merging.
There was a problem hiding this comment.
Yep, I'm waiting to write it until everything else in the PR is done and ready to merge.
| } | ||
|
|
||
| fn draw_gpu_time_overlay( | ||
| gpu_timers: Res<GpuTimerScopes>, |
There was a problem hiding this comment.
bevy_diagnostics was built to cover scenarios like this. It is intended to be a generic interface for collecting and reporting changing values over time. The intent being that it allows us to build "common" visualization tools (things like this overlay, timeline graph visualiztions in the editor, etc). Did you consider using that? Were there gaps that prevented you from using it? If so, we should fill those gaps and port this over.
There was a problem hiding this comment.
For the UI part specifically, bevy_render depends on on bevy_diagnostics, but bevy_ui depends on bevy_render, so it would be circular dependencies :/.
There's no reason the aggregating statistics part couldn't be on bevy_diagnostics though. We could do something like bevy_diagnostics aggregates the data produced by bevy_render, and then in another crate (a new one? bevy_core_pipeline?) we do the visual UI.
There was a problem hiding this comment.
Yeah the visualization logic definitely shouldn't be in bevy_diagnostics, bevy_render, or bevy_ui.
This should be the dep tree:
bevy_render -> bevy_diagnostics
nice_diagnostic_visualizer -> bevy_diagnostics
nice_diagnostic_visualizer -> bevy_ui -> bevy_render
I think we'll probably also want a "diagnostic category label" system so we can dump a bunch of render pass diagnostics in some "gpu timing" category. Then you could do something like DiagnosticVisualizerPlugin::new().show(GpuTimingDiagnostics)
There was a problem hiding this comment.
Not necessarily saying that this needs to be done in this PR, but it would make all of this visualization work generically useful / doesn't introduce quality debt. I can also take a stab if you want.
| .find(|a| a.label == timer.label) | ||
| { | ||
| Some(a) => { | ||
| a.mean_duration += timer_duration / 20.0; |
There was a problem hiding this comment.
I think this should at least be a constant that GpuTimerScopes also uses. User configurable would be even better.
| @@ -0,0 +1,19 @@ | |||
| #!/bin/bash | |||
|
|
|||
| graphics=$(nvidia-smi --query-supported-clocks=graphics --format=csv | sed -n 2p | tr -d -c 0-9) | |||
There was a problem hiding this comment.
imo we should have a windows version of this and also something for AMD if possible since this feature just won't work at all without this?
| if timer.max_duration - timer.min_duration > 0.05 { | ||
| writeln!( | ||
| durations, | ||
| "{:.3} ({:.3}, {:.3})", |
There was a problem hiding this comment.
Seems like too little precision, maybe .4?
|
A nice visualization technique I've seen: Each top level profiling group/span is associated with a random(?) color, and all sub-spans are the same color (and indented one). Visualizations I've seen also tend not to sort by timing, and keep the order stable. |
|
Instead of locking to max clocks, the script should probably lock to GPU base clocks. This is what NSight does. |
# Objective

It's useful to have access to render pipeline statistics, since they
provide more information than FPS alone. For example, the number of
drawn triangles can be used to debug culling and LODs. The number of
fragment shader invocations can provide a more stable alternative metric
than GPU elapsed time.

See also: Render node GPU timing overlay #8067, which doesn't provide
pipeline statistics, but adds a nice overlay.

## Solution

Add `RenderDiagnosticsPlugin`, which enables collecting pipeline
statistics and CPU & GPU timings.

---

## Changelog

- Add `RenderDiagnosticsPlugin`
- Add `RenderContext::diagnostic_recorder` method

---------

Co-authored-by: Alice Cecile <[email protected]>
Objective
Solution
TODO
Changelog
WgpuFeatures::TIMESTAMP_QUERY.bevy_debug_overlaysandDebugOverlaysPluginfor displaying GPU running time of a bevy app.