The stable version of the documentation can be found here.
A tool to parse photodiode events from a possibly corrupted channel, compatible with BIDS formatting.
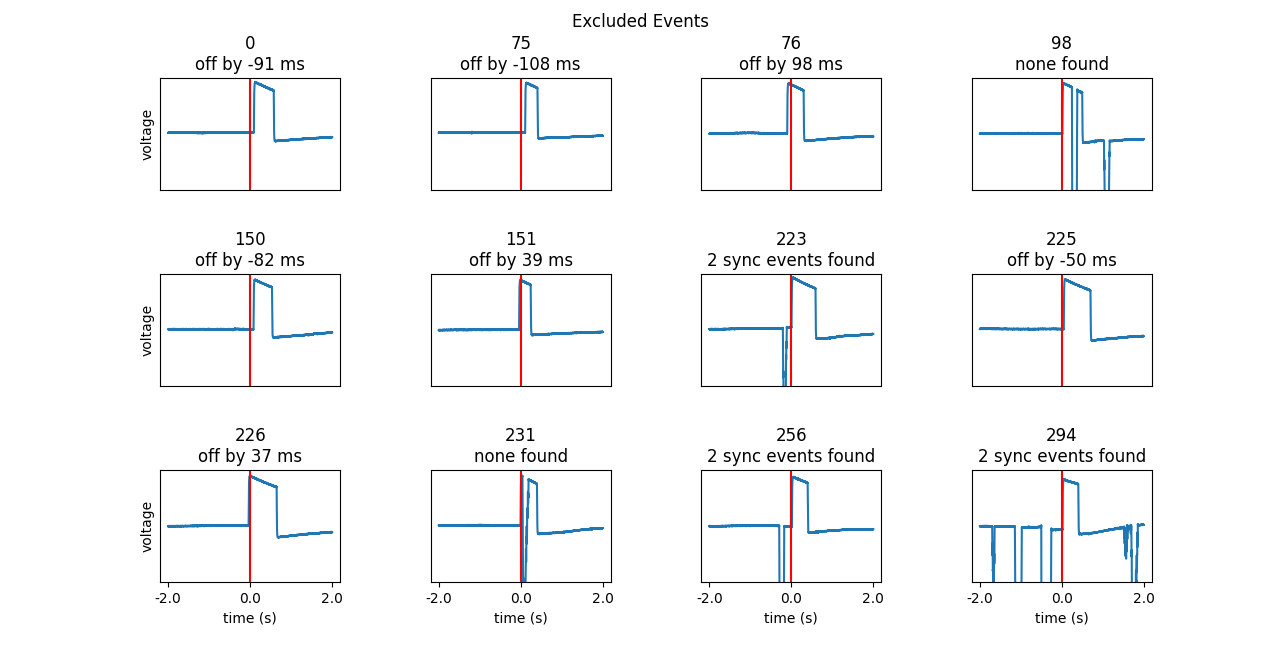
Corrupted data may look like so:
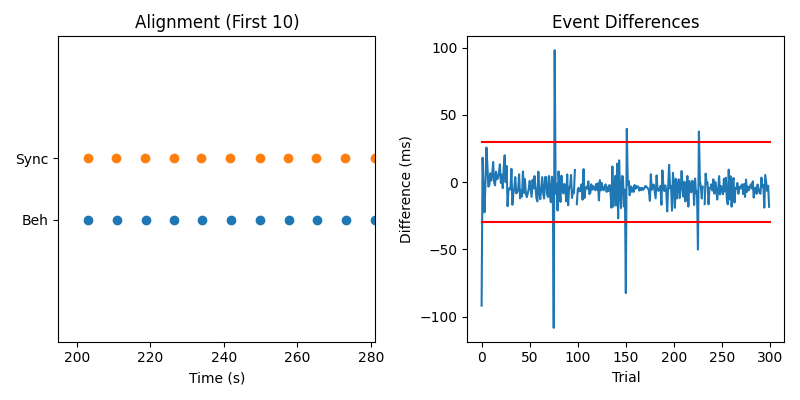
Which may lead to some excluded events and differences between the events and the expected timing based on the behavior that look like so:
pd-parser matches deflection events on a potentially corrupted photodiode channel with time-stamped events generated by the computer that changes the luminance sensed by the photodiode. This tool is for research that needs high-performance timing synchronization, especially in clinical settings where having a channel record a photodiode is the best or only method of task-integration available and where the photodiode is especially likely to be corrupted by unavoidable environmental noise. First, photodiode time series data is extracted from an electrophysiology data file. The photodiode data can be on a single channel or two channels that are then bipolar re-referenced. Candidate photodiode events from this photodiode time series are identified based on matching a square-wave template. Time-stamped events from the computer triggering changes to the luminance of the photodiode are read from a tab-separated value (tsv) file, and the best alignment of these events relative to photodiode deflection events is then found while accounting for any drift between computer clocks of separate recording devices. Events are excluded where when the difference between the photodiode event and the time-stamped event are greater then a specified threshold. This discrepancy in timing can occur when a monitor doesn't update the display for one or more frames most often because the computer paused execution of the program controlling luminance to do background tasks. Additional events can then be added using the time of each event relative to the corresponding photodiode-synchronized event. Adding relative events may be needed for any number of reasons. For instance, events may occur too rapidly in series relative to the monitor refresh rate to have a photodiode deflection for each event, or the photodiode deflection may effect neighboring channels on the amplifier with its large deflection and so be placed synchronous with an event, such the onset of fixation, where it will not effect other, more important events. Finally, the raw data and events data can be saved in brain imaging data structure (BIDS) format, which allows the behavioral events to be stored in a standardized format without modifying the underlying raw electrophysiology file.
- Install the latest version python using of anaconda
- anaconda (https://www.anaconda.com/products/individual) or
- python (https://www.python.org/downloads/)
and make sure that you add the installed packages to the path.
- Optional Create virtual environment to keep the particular versions of software relevant to this project from getting changed. In a terminal, run
conda create --name myenvand thenconda activate myenvorpython -m venv /path/to/env/myenvand thensource /path/to/env/myenv/bin/activate
Run
conda install pipin a terminal, and then ensure that when you runwhich pipin a terminal it points to the where the anaconda or python you just installed is.Run
pip install pd-parserin a terminal.
- Plot the examples in a Jupyter notebook
- In the Examples page, click on 'Download all examples in Jupyter notebooks'
- Unzip the downloaded file
- Run
pip install jupyter - Point the terminal to the folder where the files you downloaded are by running
cd /path/to/downloads/ - Run
jupyter notebookin the terminal, this will pop up a webpage in your default browser. - Change
%matplotlib inlineto just%matplotlibto pop the plots out interactively instead of below the cell in the notebook. - Run each cell, change the parameters and explore the example.
- Try pd-parser on your photodiode data. You will need:
- Time series data in
.fif,.edf,.bdf,.vhdr, or.setformat like the data from the first cell of this example. If you do not know the name of the photodiode channel, the data will be plotted and you will be asked to find it so it is not necessary to pass the name. - A behavior file in tab-separated value (tsv) format like the one created in the second cell of this example. The file needs to have:
- One column corresponding to the expected event in seconds, called by default
fix_onset_time - Optionally Other columns with relative event times in seconds.
- One column corresponding to the expected event in seconds, called by default
- How to run:
- See the example notebooks for information on how to extract parameters for
pd_parser, use the parameters to detect events, and saving the events and data in a BIDS-compatible format.
- See the example notebooks for information on how to extract parameters for
- Time series data in
Use the GitHub issue tracker to report bugs.
Please see our contributing guide. `
Alex Rockhill Eugene, OR 2020

