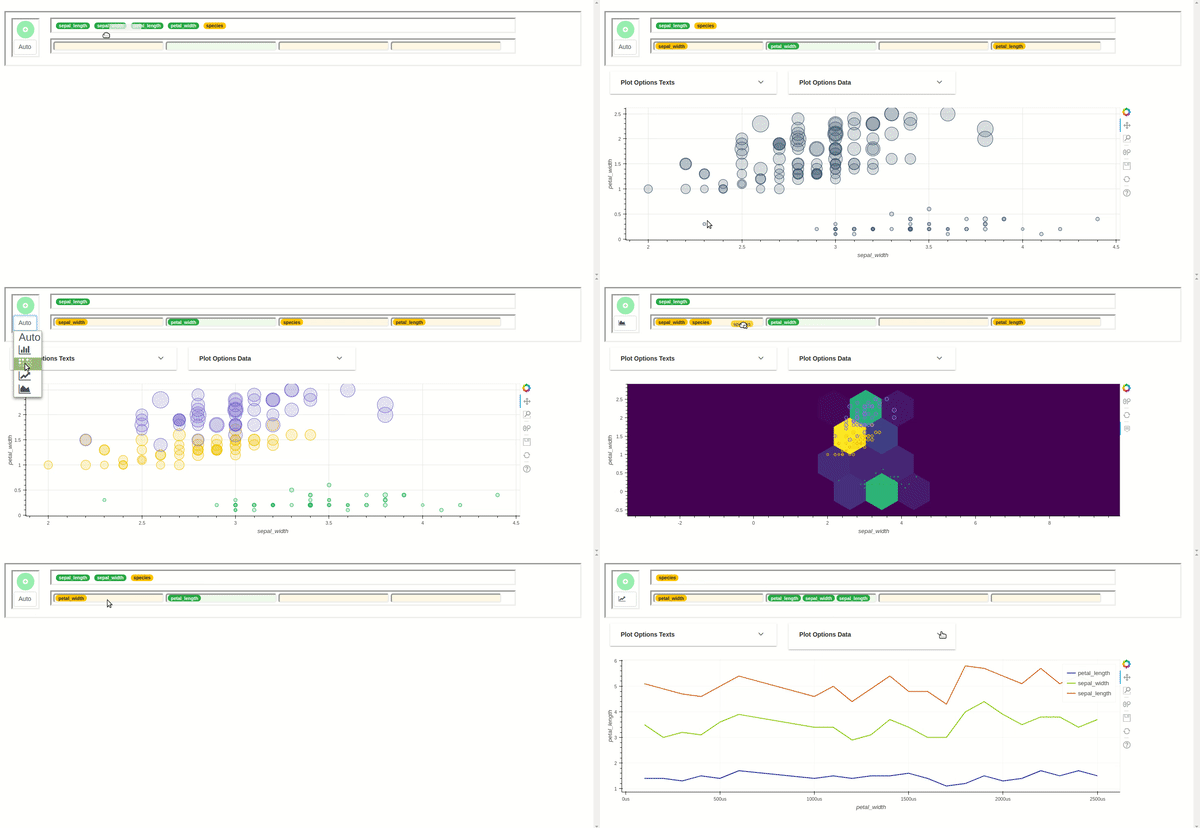
The purpose of this tool which still on development is to let you explore your data quickly to extract the information they hold. You can only create simple plots.
This tool allows you to interactively explore your data by visualizing it with the olapy and bokeh packages. It allows you to draw bar graphs, circles, lines plots..., then export the graph.
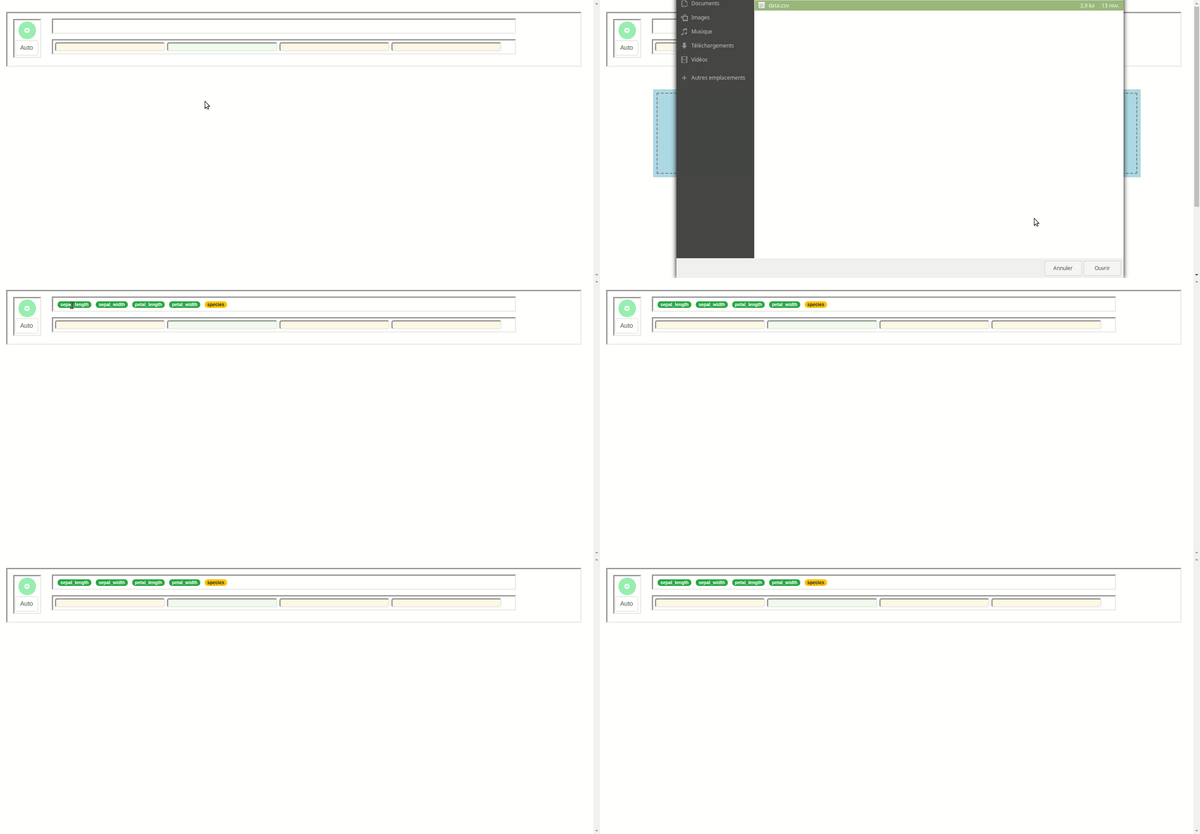
Start by importing your data (as csv files format right now), you can import either one file containing all your data, or separated files dataset which follows star schema model
(you can use the two data sets demos in the repository as example)
Now lets construct some charts, to do so, drag and drop variables to x and y axis
Options-menus are available under the chart to modify some parameters:
First you need to clone the repository with:
git clone https://github.com/abilian/olapy-viz.git
install dependencies, ideally in a virtualenv with:
make install
run it with:
make run
and then go to http://localhost:5000/

