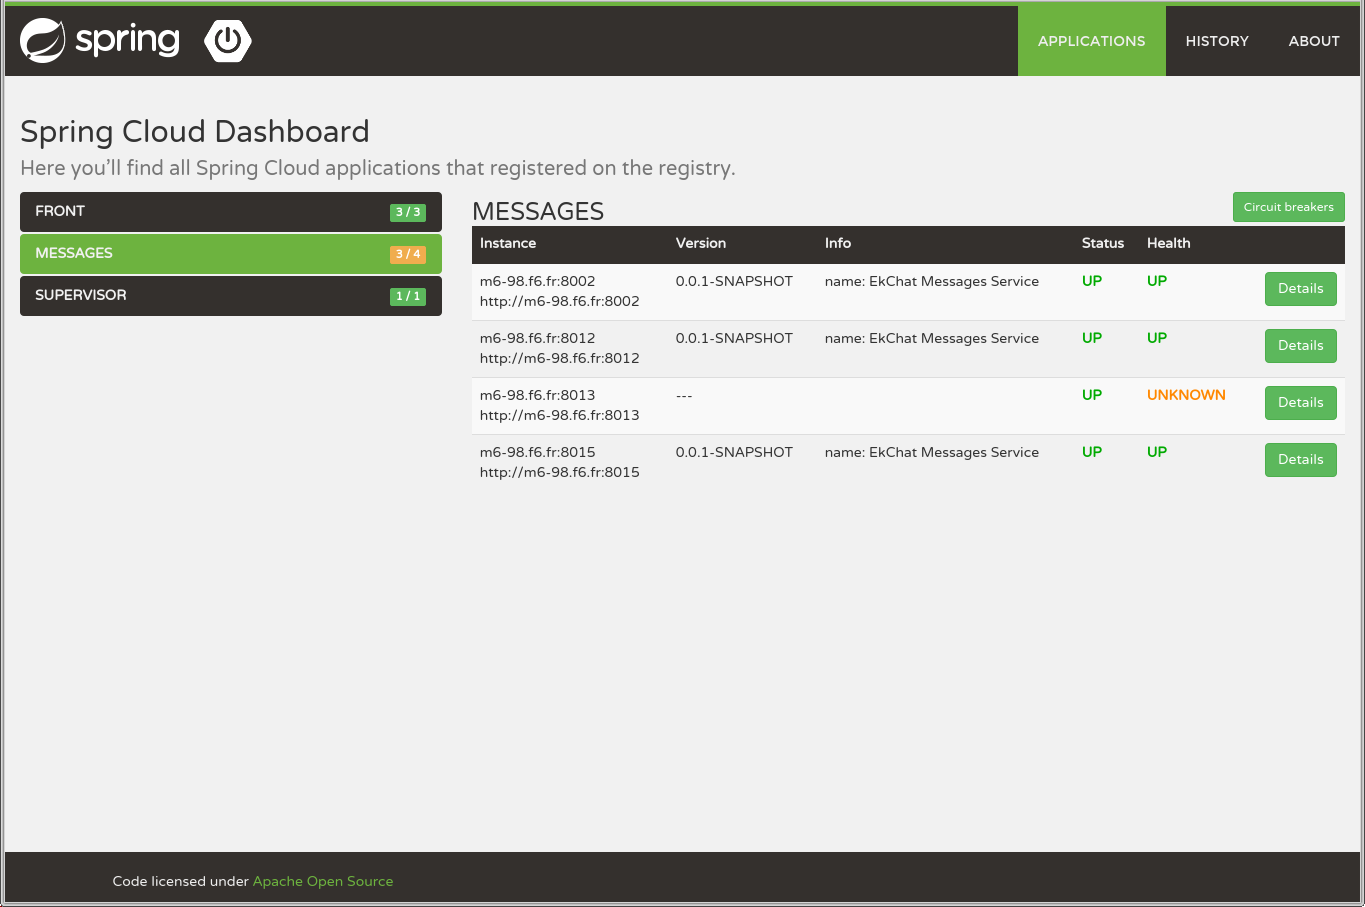
This application provides a simple GUI to administrate Spring Cloud applications infrastructure. It's a fork of Spring Boot Admin to manage applications registered in service registry (Netflix Eureka and AWS Beanstalk).
At the moment it provides the following features for every registered application (most of then inherited of spring-boot-admin).
- Show name/id and version number
- Show health status
- Show details, like
- Java System- / Environment- / Spring properties
- JVM & memory metrics
- Counter & gauge Metrics
- Datasource Metrics
- Easy loggerlevel management
- Interact with JMX-Beans
- View Threaddump
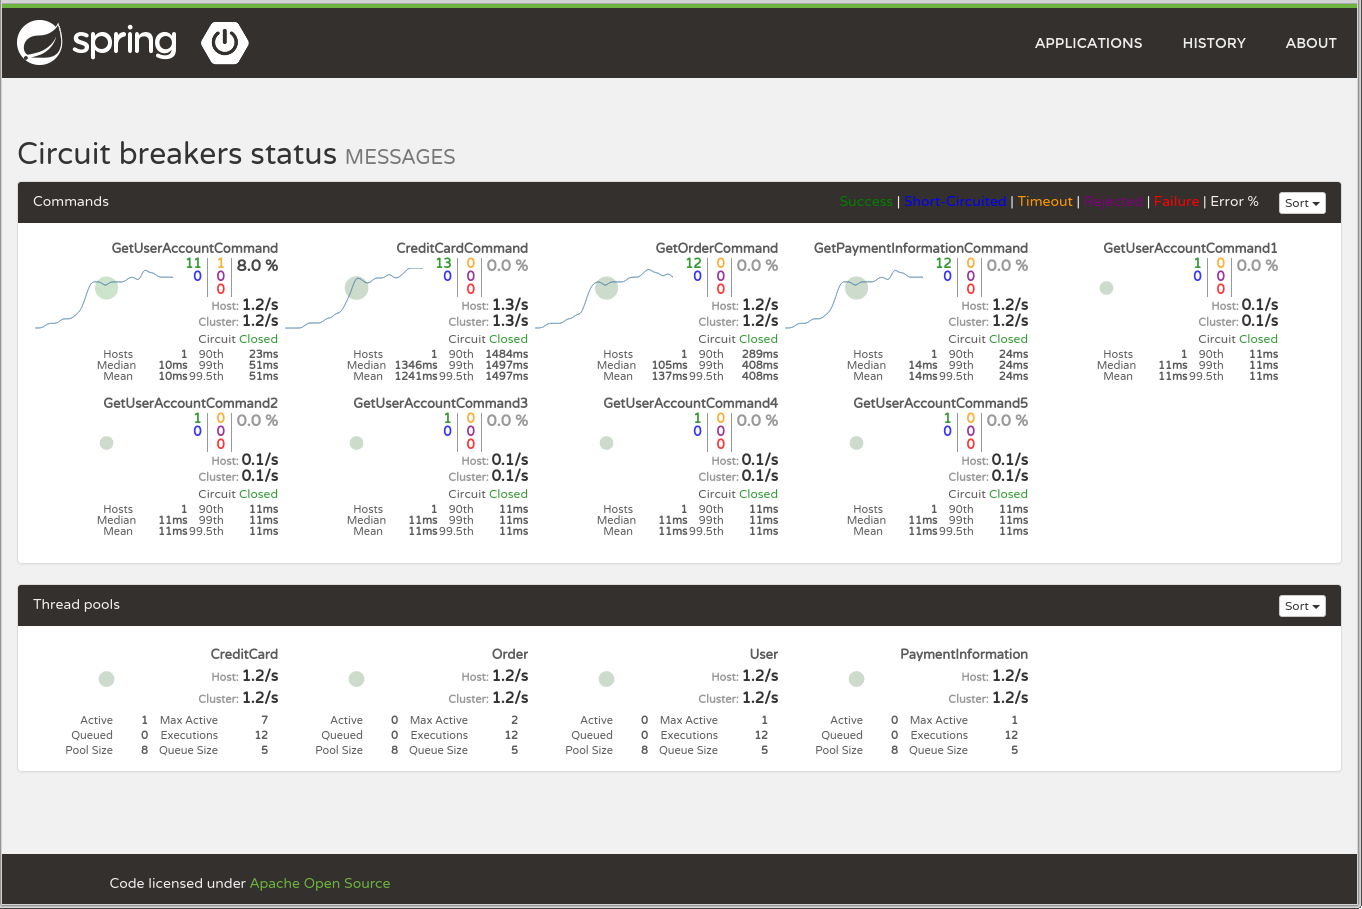
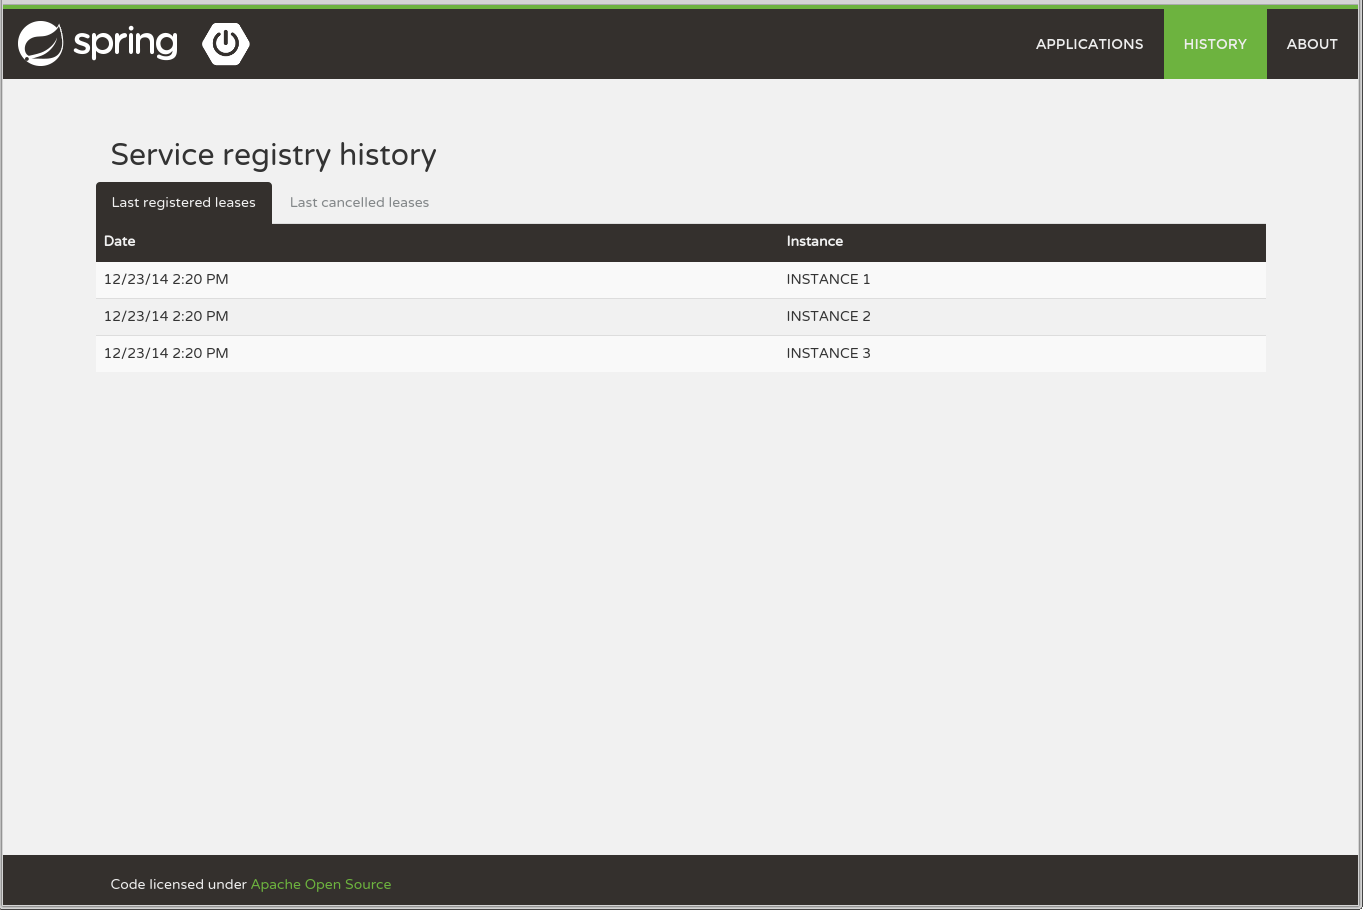
Any specific spring cloud information are also available in dashboard
- Application registry history ( from Eureka Server )
- Circuit Breaker dashboard ( from Hystrix or Turbine )
Add the following dependency to your pom.xml after you have build this project locally.
<dependency>
	<groupId>com.github.vanroy</groupId>
	<artifactId>spring-cloud-dashboard</artifactId>
	<version>1.2.0.RELEASE</version>
</dependency>
Create the Spring Cloud Dashboard with only one single Annotation.
@SpringBootApplication
@EnableEurekaServer
@EnableDiscoveryClient
@EnableCloudDashboard
public class Application {
	public static void main(String[] args) {
		SpringApplication.run(Application.class, args);
	}
}
Spring Cloud Dashboard uses an Apache HTTP Client to query your instance's actuator endpoints. Sometimes it is possible that these endpoints are secured. Configurations are available to customize you http client with Basic pre authorization headers.
spring:
  cloud:
    dashboard:
      http:
        # Basic Credentials
        username: user
        password: password

        # Optional Defaults values
        maxConnection: 100
		connectTimeout: 1000
		socketTimeout: 2000
		requestTimeout: 1000
Samples are available in this repository : https://github.com/VanRoy/spring-cloud-dashboard-samples


