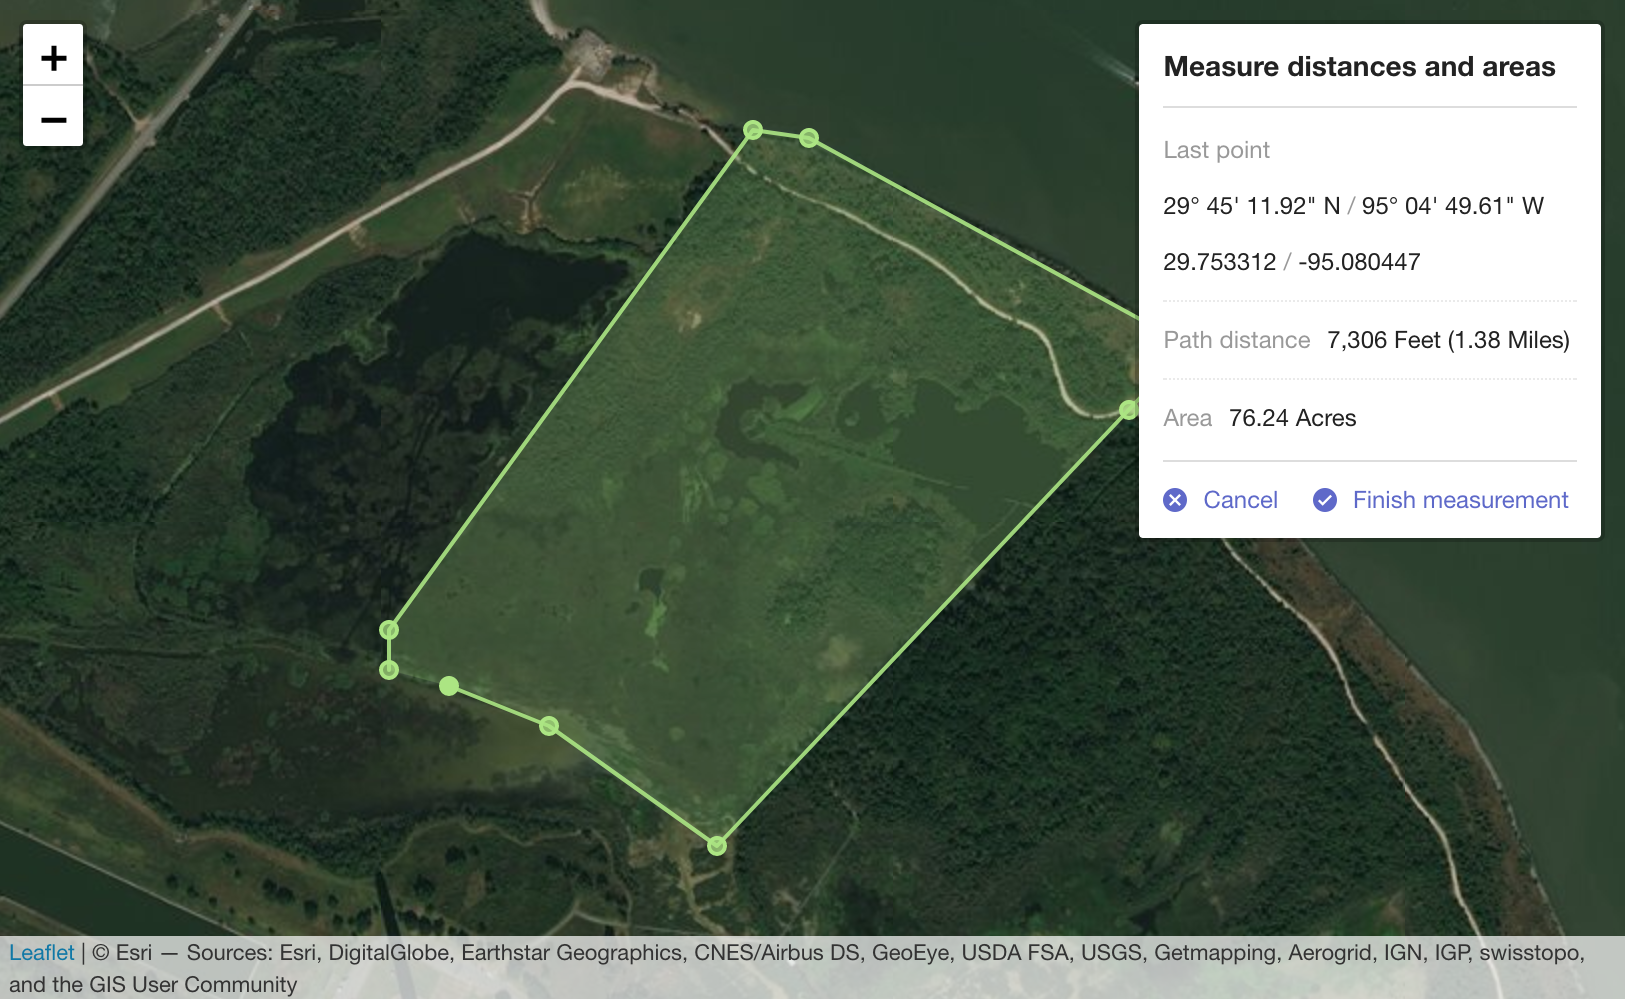
Coordinate, linear, and area measure control for Leaflet maps. Extends L.Control.
TODO. Add usage
leaflet-measure adds L.Control.Measure. This control may be used with the standard Leaflet control workflows described in the Leaflet docs.
The measure control can be instantiated directly and added to a map:
var myMap = L.map('mapElementId', options);
var measureControl = new L.Control.Measure(options);
measureControl.addTo(myMap);
or instantiated via the factory:
var myMap = L.map('mapElementId', options);
var measureControl = L.control.measure(options);
measureControl.addTo(myMap);
or added to a map using map options:
var myMap = L.map('mapElementId', {
  measureControl: true
});{ position: 'topright' }
Standard Leaflet control position options
{ primaryLengthUnit: 'feet', secondaryLengthUnit: 'miles' }
Units used to display length results. secondaryLengthUnit is optional.
Valid values are feet, meters, miles, and kilometers
{ primaryAreaUnit: 'acres', secondaryAreaUnit: undefined }
Units used to display area results. secondaryAreaUnit is optional.
Valid values are acres, hectares, sqfeet, sqmeters, and sqmiles
{ activeColor: '#ABE67E' }
Base color to use for map features rendered while actively performing a measurement. Value should be a color represented as a hexadecimal string.
{ completedColor: '#C8F2BE' }
Base color to use for features generated from a completed measurement. Value should be a color represented as a hexadecimal string.
popupOptions: { className: 'leaflet-measure-resultpopup', autoPanPadding: [10, 10] }
Options applied to the popup of the resulting measure feature. Properties may be any standard Leaflet popup options.
Custom units to make available to the measurement calculator. Packaged units are feet, meters, miles, and kilometers for length and acres, hectares, sqfeet, sqmeters, and sqmiles for areas. Additional unit definitions can be added to the packaged units using this option.
Define units as
{
  someNewUnit: {
    factor: 0.001, // Required. Factor to apply when converting to this unit. Length in meters or area in sq meters will be multiplied by this factor.
    display: 'My New Unit', // Required. How to display in results, like.. "300 Meters (0.3 My New Unit)".
    decimals: 2 // Number of decimals to round results when using this unit. `0` is the default value if not specified.
  },
  myOtherNewUnit: {
    factor: 1234,
    display: 'My Other Unit',
    decimals: 0
  }
}{ captureZIndex: 10000 }
Z-index of the marker used to capture measure clicks. Set this value higher than the z-index of all other map layers to disable click events on other layers while a measurement is active.
{ decPoint: '.', thousandsSep: ',' }
Decimal point and thousands separator used when displaying measurements. If not specified, values are defined by the localization.
You can subscribe to the following events on the Map using these methods
Fired when measurement starts
Fired when measurement finishes with results of the measurement. Results data includes:
-
area: Area of a polygon measurement in sq meters. 0 for measurements with less than 3 points. -
areaDisplay: Area formatted as displayed in the popup. -
lastCoord: Last point clicked in both decimal degrees and degress/min/seconds. -
length: Length of the measurement in meters. 0 for measurements with less than 2 points. -
lengthDisplay: Length formatted as displayed in the popup. -
pointCount: Number of points directly added by the user. -
points: Array of points asLatLngused to calculate the measurement. Number of items in the array may differ frompointCointbecause an additional point is added to close polygons during polygon measurements.
Map features may be styled using CSS SVG style attributes. Features generated from leaflet-measure measurements are given the following class names:
-
layer-measurearea: Feature displaying area of an active measurement
-
layer-measureboundary: Feature displaying the linear path of an active measurement
-
layer-measurevertex: Feature added at each vertex (measurement click) of an active measurement
-
layer-measuredrag: Symbol following cursor while moving during an active measurement
-
layer-measure-resultarea: Feature added to the map as a permanent layer resulting from an area (3+ points) measurement
-
layer-measure-resultline: Feature added to the map as a permanent layer resulting from a linear (2 point) measurement
-
layer-measure-resultpoint: Featured added to the map as a permanent layer resulting from a point (single click) measurement
The build process uses npm (Node Package Management) which comes with Node.js.
After you have Node.js installed you can do npm install to install dependencies and npm run-script start:dev to initialize a local server (localhost:8080) for leaflet-measure assets.
It detects modifications on source files and re-compiles to /leaflet-measure.css and /leaflet-measure.js.
With npm installed do npm install to install dependencies and npm run-script build to generate dist/leaflet-measure.css and dist/leaflet-measure.js.
It will also generate dist/leaflet-measure.{locale}.js files for each localization available.
TODO. Internationalization
