OpenStudio v2.2.0
These release notes describe version 2.2.0 of the OpenStudio software suite developed by the National Renewable Energy Laboratory (NREL), Buildings and Thermal Systems, Commercial Buildings Research Group, Tools Development Section, and associated collaborators. The notes are organized into the following sections:
- Where to Find OpenStudio Documentation
- Installation Notes
- Overview
Where to Find OpenStudio Documentation
- OpenStudio release documentation, including these release notes, tutorials, and other user documentation, is available at https://www.openstudio.net/.
- C++ API documentation is available at https://openstudio-sdk-documentation.s3.amazonaws.com/index.html.
- Measure development documentation is available at http://nrel.github.io/OpenStudio-user-documentation/reference/measure_writing_guide/.
Installation Notes
OpenStudio is supported on Windows 7 – 10, OS X 10.10 – 10.11, and 64-bit Ubuntu 14.04.
OpenStudio 2.2.0 supports EnergyPlus Release 8.7.0, which is bundled with the OpenStudio installer. It is no longer necessary to download and install EnergyPlus separately. Other builds of EnergyPlus are not supported by OpenStudio 2.2.0.
OpenStudio 2.2.0 supports Radiance 5.0.a.12, which is bundled with the OpenStudio installer; users no longer have to install Radiance separately, and OpenStudio will use the included Radiance version regardless of any other versions that may be installed on the system. Other builds of Radiance are not supported by OpenStudio 2.2.0.
Installation Steps
- The OpenStudio SketchUp Plug-in requires SketchUp 2017 (not available for Linux). The OpenStudio SketchUp Plug-in does not support older versions of SketchUp.
- If the OpenStudio Plug-in does not automatically load in SketchUp, open the Window->Preferences->Extensions window in SketchUp and enable the OpenStudio plug-in if it is listed.
- Download and install OpenStudio.
- Setup a Building Component Library (BCL) account to access online building components and measures. View instructions on how to setup your account and configure the key in OpenStudio.
Overview
DView: the future ResultsViewer replacement
For many years, OpenStudio has included ResultsViewer to visualize timeseries data. The plan for the next OpenStudio release (2.3.0) is to replace ResultsViewer with a visualization tool called DView, which was originally developed for viewing Residential Building and Solar data. DView brings additional capabilities that ResultsViewer does not have, including IP unit conversion, CSV data export, image export, EPW weather file visualization, two synchronized views, stacked timeseries, average profiles, overview statistics, histograms, cumulative density plots, duration curves, and scatter plots.
DView can load EnergyPlus .sql files just like ResultsViewer. Please download DView via the links below, try it out, and send any feedback you may have.
https://github.com/NREL/wex/releases
The Hourly, Daily, and Monthly graphs allow you to turn variables on or off with a single click, and to zoom and pan very easily. DView has the ability to display simultaneous line and stacked areas as demonstrated in the Hourly graph below.

Hourly graph
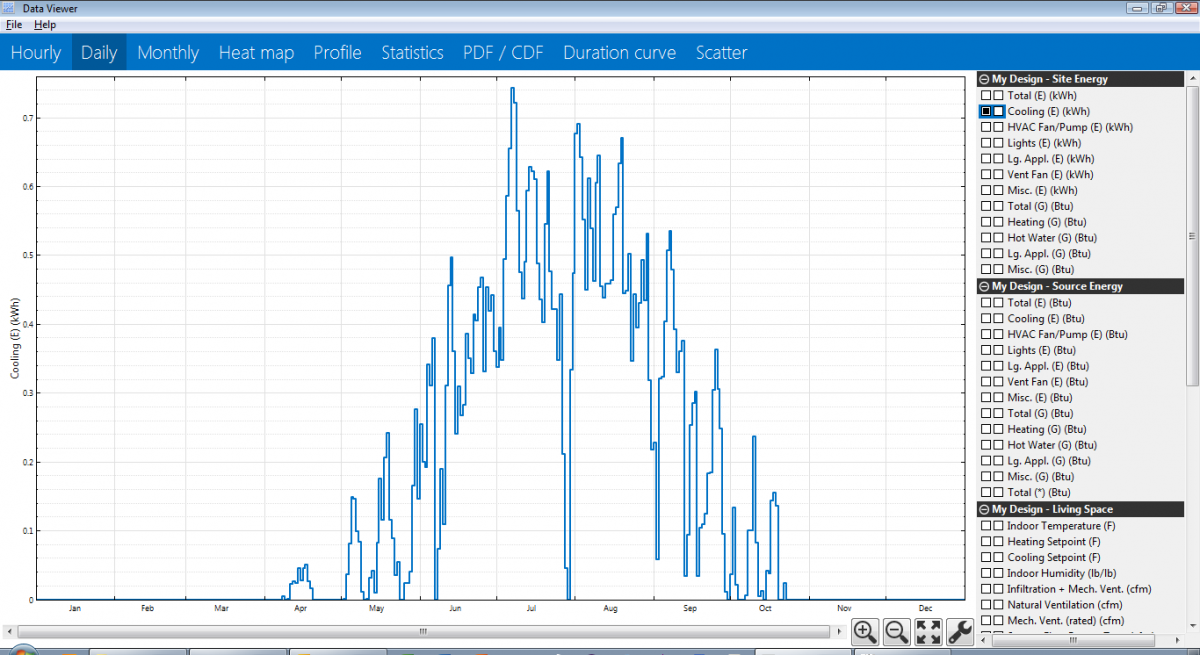
Daily and Monthly timeseries graphs are automatically created by averaging or summing the hourly data:

Hourly graph
If the underlying data is sub-hourly, an additional Timeseries graph displays the raw data and the Hourly graph becomes the result of averaging or summing. If the underlying data is multi-hourly (for example, a 3-hour timestep), a Timeseries graph displays the raw data, there is no Hourly graph, and the Monthly graph is the result of averaging or summing the timeseries data
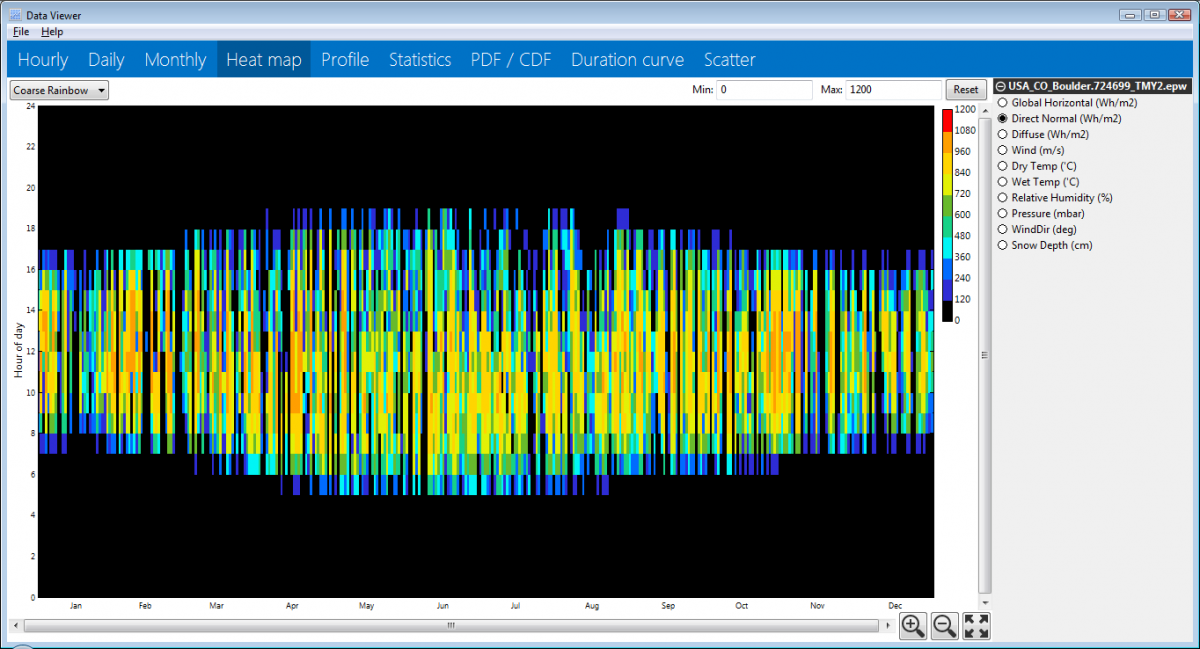
The Heat Map graph displays a whole year of data at once, with the day of the year on the x-axis and time of day on the y-axis, so that each time step corresponds to a small rectangle. That rectangle gets assigned a color based on the value in that time step. Using this format, it is possible to identify both diurnal and seasonal patterns. The example below shows the direct normal solar radiation in Boulder, Colorado from the TMY2 data set. The image shows that the days are longer in the summer than in the winter, the most intense direct radiation values tend to occur in the spring and fall, and summer afternoons tend to be cloudy:

Heat map graph
The Profile graph illustrates average daily profiles for each month of the year (with the ability to also show an annual average daily profile). The graph below demonstrates daily profiles for electric cooling and gas heating in a building:

Profile graph
The Statistics table shows annual or monthly statistical values (e.g., mean, minimum, maximum, sum) for each variable in tabular format:

Statistics table
The PDF/CDF graph shows the Probability Distribution Function (PDF) and Cumulative Distribution Function (CDF) for the dataset. These functions are useful to illustrate the distribution and spread of values for a given variable:

PDF/CDF graph
The Duration curve orders the data from highest value to lowest value. By doing so, one can quickly identify, for example, the number of hours for which the variable is above or below a certain threshold:

Duration curve graph
The Scatter plot allows graphing one or more y-axis variable against an x-axis variable. For example, the below graph shows a scatter plot for space heating and space cooling in a building as a function of outdoor drybulb temperature. It can also be useful to compare measured data against simulated data (for which the "line of perfect agreement" can also be displayed).

Scatter plot
OpenStudio Application
OpenStudio Application now provides a newly implemented 3D geometry preview tab.
OpenStudio Model
OpenStudio Model received the following updates:
- Exposed SetpointManager:FollowGroundTemperature - Reference Ground Temperature Object Type to the OpenStudio API
- Added UnitarySystemPerformance:Multispeed object
- Allowed Availability Manager to be attributed to Plant Loop
- Permitted glycols to be used in Plant Loop
- Added GroundHeatExchanger:Vertical gFunctions
Additionally, the following objects have been wrapped:
- GeneratorFuelCell
- GeneratorFuelCellPowerModule
- GeneratorFuelCellPowerModule
- GeneratorFuelCellAirSupply
- GeneratorFuelCellWaterSupply
- GeneratorFuelCellAuxiliaryHeater
- GeneratorFuelCellExhaustGasToWaterHeatExchanger
- GeneratorFuelCellElectricalStorage
- GeneratorFuelCellInverter
- GeneratorFuelCellStackCooler
- GeneratorFuelSupply
The GeneratorFuelCellExhaustGasToWaterHeatExchanger object works in the OpenStudio Application and when added to a plant loop, adds all necessary GeneratorFuelCell and related components to the model and is user-configurable in the OpenStudio Application.
OpenStudio Standards Gem
OpenStudio Standards Gem was updated 0.1.15. This added additional HVAC system types.
OpenStudio Workflow Gems (WFG)
OpenStudio Workflow Gems have been updated to 1.3.0 which offers the following refinements:
- ScriptError subclasses, including LoadError and SyntaxError, as well as NoMemoryError are now handled by the WFG and persisted to the log
- New method runner.haltWorkflow(completedStatus) stops the execution of additional measures and the simulation, and sets the datapoint's completion status appropriately
OpenStudio Server
OpenStudio Server’s robustness has been improved with the following updates:
- Fixed an issue where output variables would overwrite each other if the same measure was run multiple times
- Ensured that all results are available in the csv results list, not just those which were completed successfully
- Changed algorithm retry procedures to ensure no infinite looping of datapoints
- Support datapoints being halted using the runner.haltWorkflow method
- Minor extensibility improvements
- Ensured all deployment environments support configuration of the R queue size
- Variable distribution plots are working again for LHS analyses
Issue Statistics Since Previous Release
- 111 new issues were filed since the 2.1.0 release of OpenStudio (not including opened pull requests).
- 154 issues were closed since the 2.1.0 release of OpenStudio (not including closed pull requests).

