This repository contains a framework for iteractive visualization of algorithms based on widgets in jupyter notebook. Here are some examples of animations generated by the framework. The code is provided in overview notebook
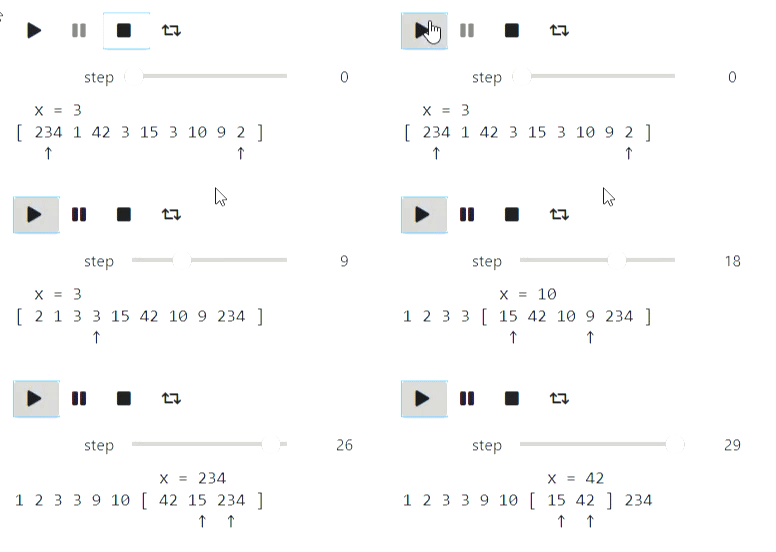
Here's an example of quicksort algorithm using text state representation
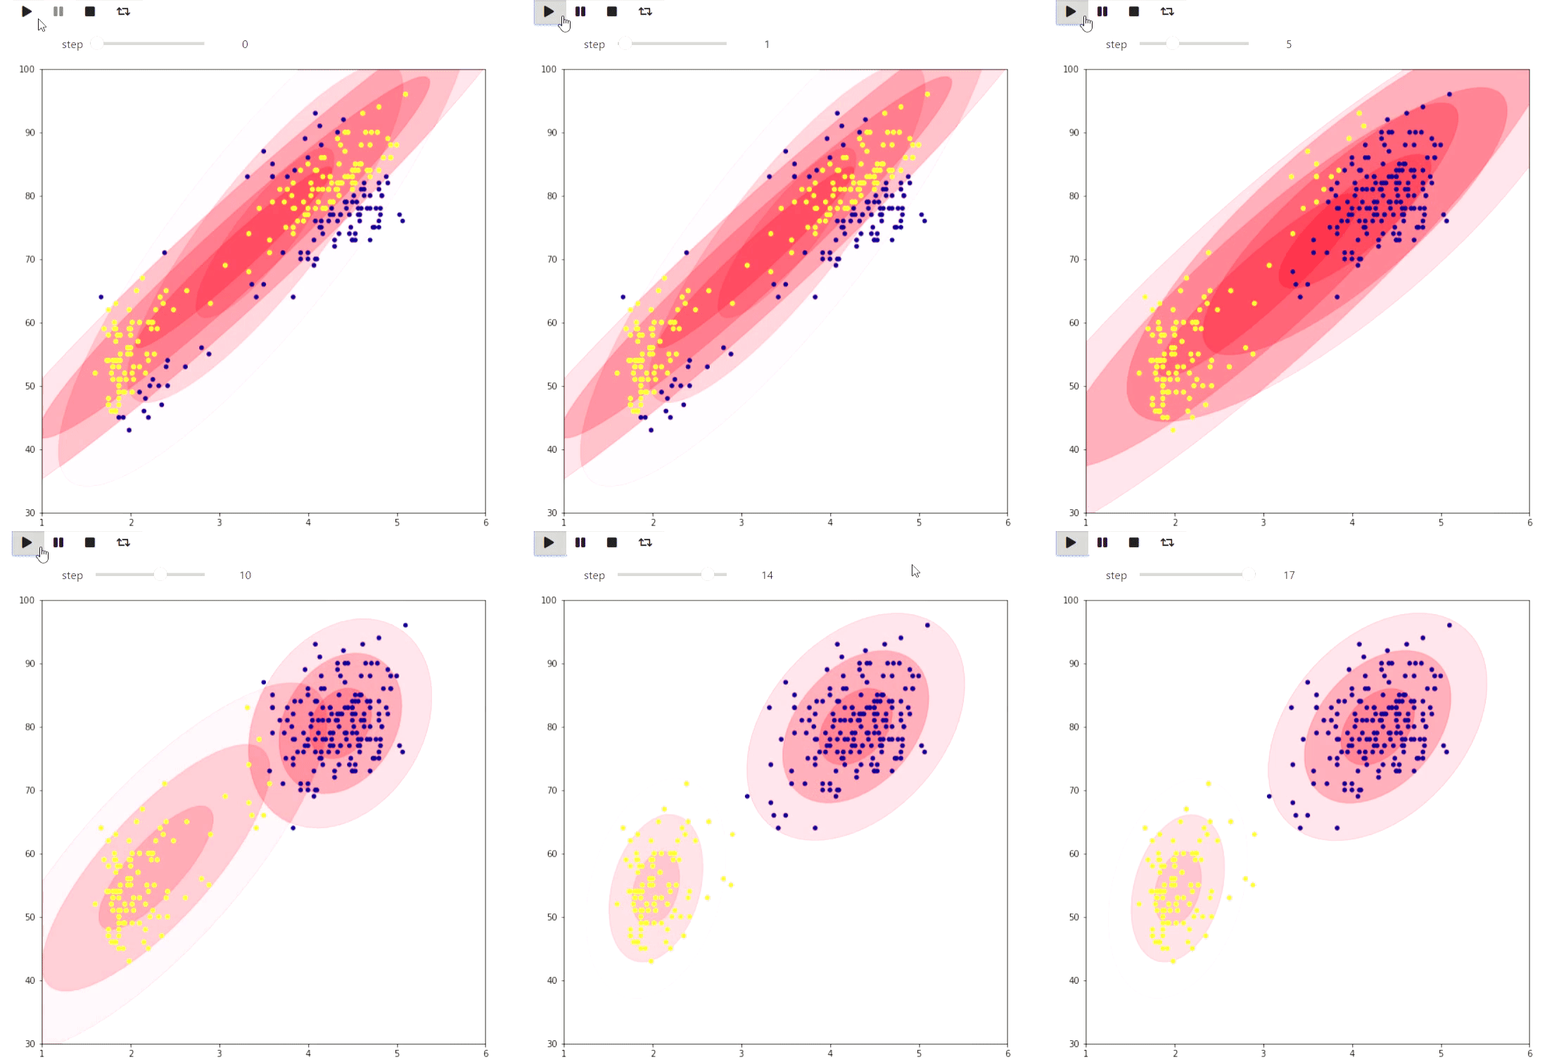
Using matplotlib one can visualize some plane algorithm, for example EM algorithm for Old Faithfull eruption data
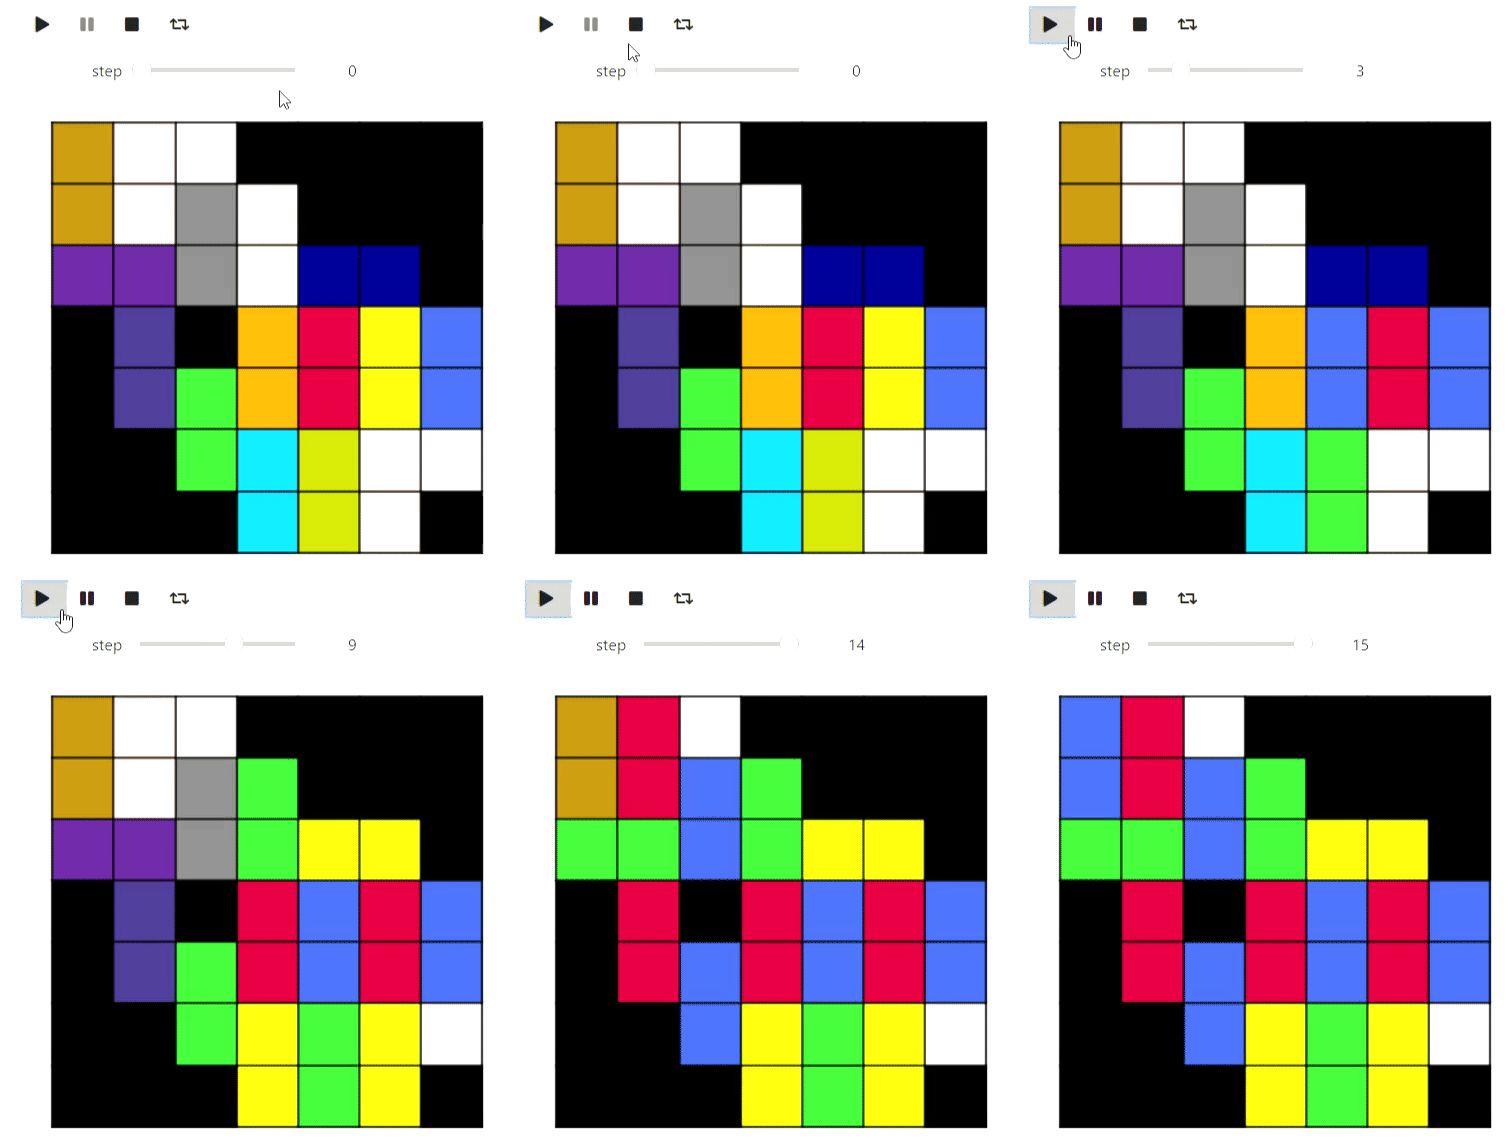
or domino coloring based on 5-coloring algorithm for planar graphs
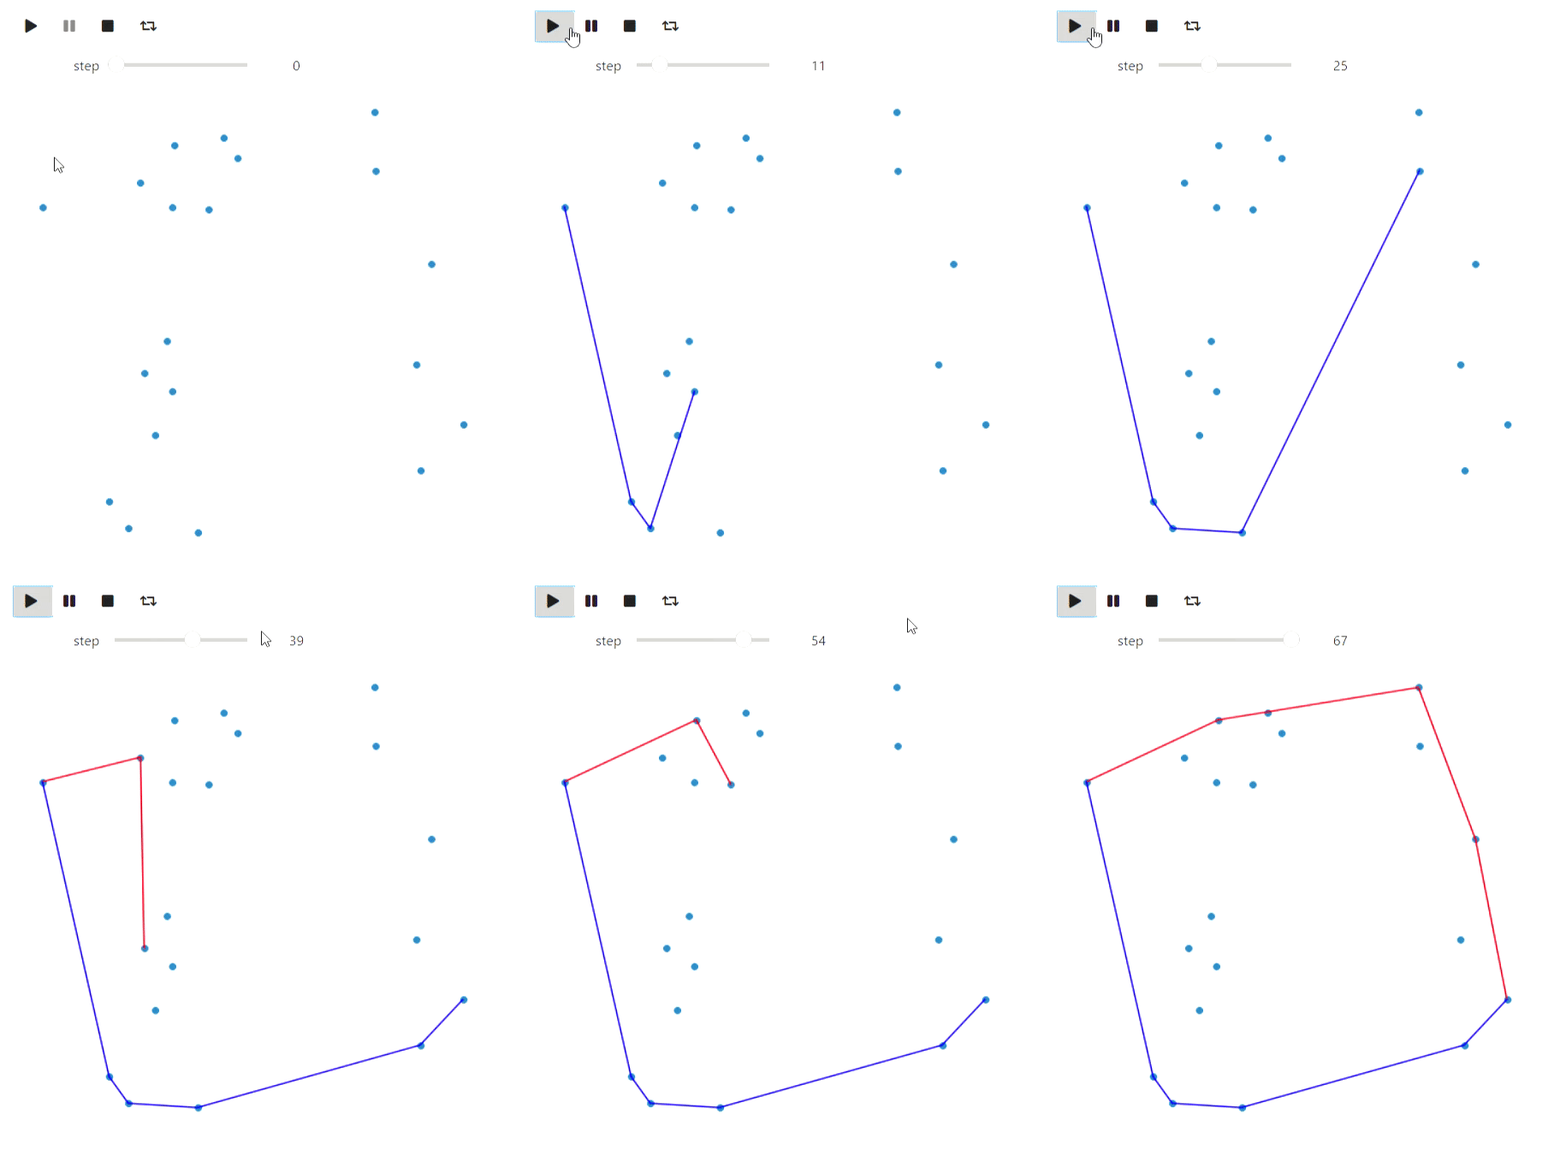
or convex hull construction
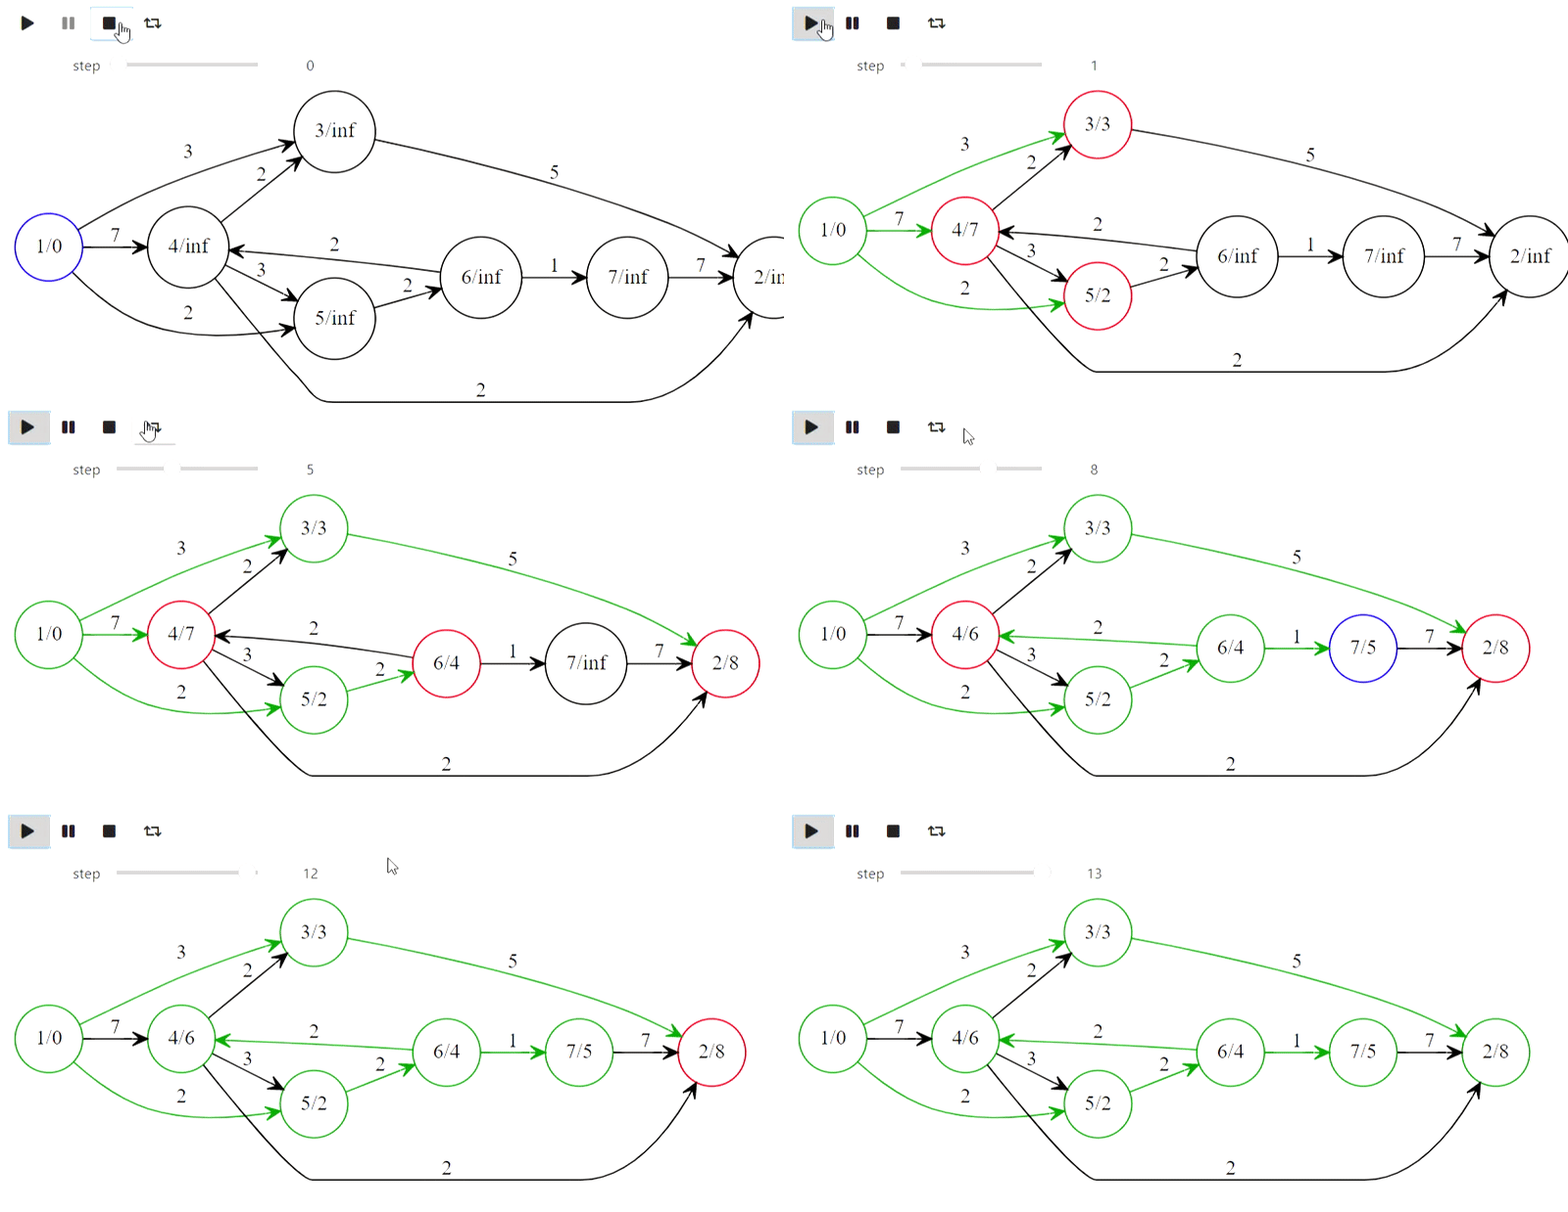
Using graphviz one can visualize basic graph algorithms, here's an example of Dijkstra algorithm
A proper installation on debian-based systems is
cat apt.txt | xargs sudo apt-get install
pip install interactive-visualization
For other linux-based OS use the appropriate package manager to install packages listed in apt.txt which currently contains graphviz and latex needed for proper visualization in notebooks. Note that there also might be problems with ipywidgets in jupyter lab, check the docs for installation instructions.
See manual for more reference.
Some basic parse and analysis of global Covid-19 data from Johns Hopkins University.
Рассматривается задача покрытия фигур на плоскости, состоящиех из квадратных клеток одинакового размера и два её программных решения: с помощью динамического программирования по профилю и с помощью нахождения максимального паросочетания. Бонусом идет раскраска планарного графа в 5 цветов (не протестировано).
Разобраны обходы в глубину и ширину, а так же их базовые применения.
Основные алгоритмы для задачи о крайших путях от одной вершины до всех остальных. Все алгоритмы представлены как модификации "сканирующего метода".
Префиксное дерево, префикс-функцию, алгоритм Ахо-Корасик и их применения в марковских моделях для обработки текста.
