The methods from this package are based on a paper published in Conservation Biology. The packages provides a set of functions to set up a migratory connectivity matrix, and then use this matrix to calculate the maximum flow of birds/animal through the migratory network, and then prioritise sites for conservation.
This package relies on igraph, fields, sp and stats. If there are any problem installing migflow, ensure these are working.
To install this package from github, make sure you first have devtools installed.
install.packages("devtools")Once devtools is installed, use:
devtools::install_github("KiranLDA/migflow")The package relies on there being a little tracking data (start & stop latitude and longitude of a migratory movement) and a list of potential stopover sites that animals can use with counts. The method then estimates the likelihood of individuals moving between sites based on the distance between those sites and the relative number of individuals recorded at each site and allocates the population through this network.
# load library
library(maxflow)

# Simulate 10 fake tracks with a mean distance of 500km
tracks <- rnorm(10, 500, 200)
rgamma(10, 500, 200)

# Create a fake list of sites where animals were seen at, with latitude, longitude and number of anumals seen there
dta <- data.frame(Site= LETTERS[1:5], Lat= 1:5, Lon= 6:10, Pop=100:104)

# create a distance matrix based on these data
dist <- point2DIST(dta)

# calculate the probability of going between these sites given the distance the animal can travel
Dist_P <- distPROB(tracks, dist, adjust=2, plot=TRUE)

# Calculate proportion of population using a site
Pop_P <- nodePopPROP(dta, 300000)

#Calculate the azimuth angle
Azi_P <- absAZIMUTH(dist, lonlats=dta)

# make birds/animals prefer sites which a larger proportion of the population has been seen and where the distance is better
network <- Dist_P * Pop_P * Azi_P

# Make the network directed
network <- directedNET(network, include_diagonal = TRUE)

#estimate number of birds entering and exiting sites based on distance, population count and azimuth
network <- popPROP(network, 300000)

#Add supersource and sink nodes
network <- addSUPERNODE(network, sources=c("A","B"), sinks= c("D", "E"))
networkIt's also possible to generate random networks
pop=100000
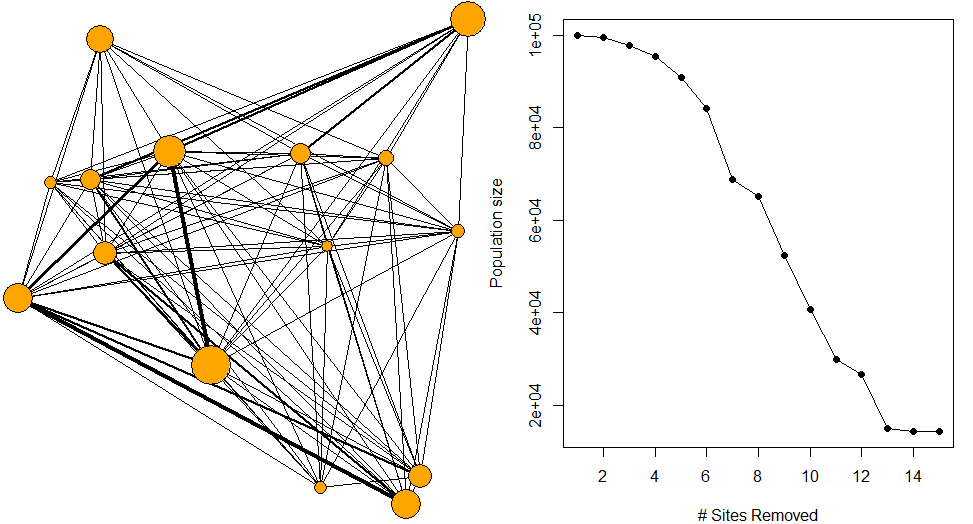
rand_net = randomNET(nsites=15,pop=pop)This uses a reverse greedy approch to find sites which contribute least to population flow, remove them, and reallocate population flow through the network based on the carrying capacity of remaining sites. This process is done iteratively until no sites are left.
# priotise sites according to flow through network
prioritiseFLOW(rand_net$network, rand_net$sites)# with fewer edges
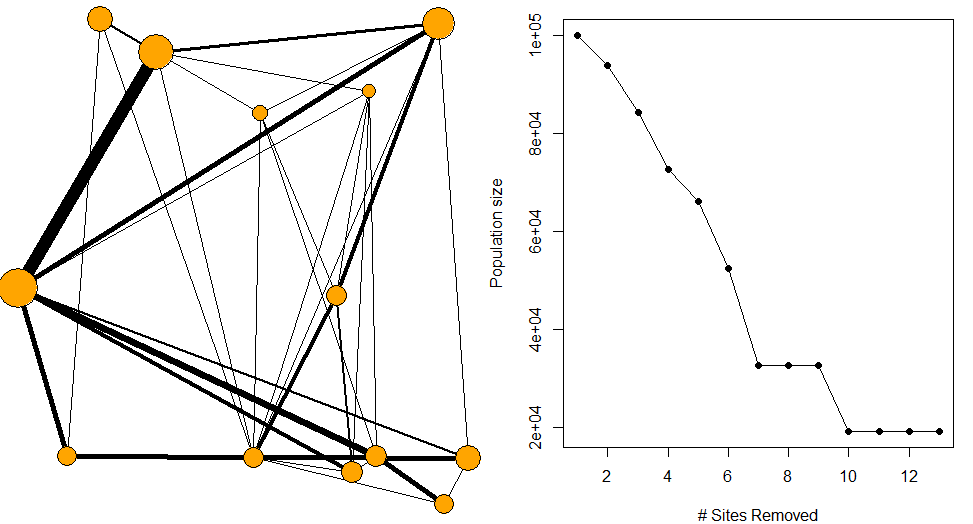
pop=100000
rand_net = randomNET(nsites=15,pop=pop, nedges=40)
# priotise sites according to flow through network
prioritiseFLOW(rand_net$network, rand_net$sites)pop=100000
rand_net = randomNET(nsites=100,nbreeding=3, nwintering=3,pop=pop, mean_dist = 8000, sd_dist=9000, plot=F)
# priotise sites according to flow through network
prioritisation = prioritiseFLOW(rand_net$network, rand_net$sites, plot=F)
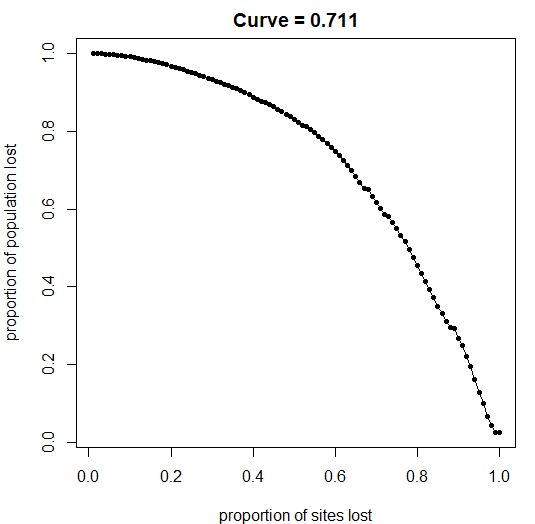
y=(prioritisation$prioritisation$Pop_Flow/pop)
x=(1:length(prioritisation$prioritisation$Pop_Flow))/length(prioritisation$prioritisation$Pop_Flow)
# calculate area under curve
AUC = curvCALC(x,y)
par(mfrow=c(1,1), mar=c(4,4,2,1))
plot(x,y,type="o",pch=20,
xlab = "proportion of sites lost",
ylab = "proportion of population lost",
main = paste0("Curve = ",AUC))Kiran Dhanjal-Adams
Dhanjal‐Adams, K. L., Klaassen, M. , Nicol, S. , Possingham, H. P., Chadès, I. and Fuller, R. A. (2017), Setting conservation priorities for migratory networks under uncertainty. Conservation Biology, 31: 646-656. doi:10.1111/cobi.12842
This project is licensed under the GNU General Public License version 3 - see the LICENSE file for details


