| Documentation | Build Status |
|---|---|
  |
Julia implementation of Layerwise Relevance Propagation (LRP) and Concept Relevance Propagation (CRP) for use with Flux.jl models.
This package is part of the Julia-XAI ecosystem and compatible with ExplainableAI.jl.
This package supports Julia ≥1.10. To install it, open the Julia REPL and run
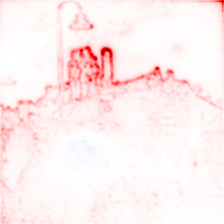
julia> ]add RelevancePropagationLet's use LRP to explain why an image of a castle gets classified as such using a pre-trained VGG16 model from Metalhead.jl:
using RelevancePropagation
using VisionHeatmaps         # visualization of explanations as heatmaps
using Flux, Metalhead        # pre-trained vision models in Flux
using DataAugmentation       # input preprocessing
using HTTP, FileIO, ImageIO  # load image from URL
using ImageInTerminal        # show heatmap in terminal


# Load & prepare model
model = VGG(16, pretrain=true).layers
model = strip_softmax(model)
model = canonize(model)

# Load input
url = HTTP.URI("https://raw.githubusercontent.com/Julia-XAI/ExplainableAI.jl/gh-pages/assets/heatmaps/castle.jpg")
img = load(url)

# Preprocess input
mean = (0.485f0, 0.456f0, 0.406f0)
std  = (0.229f0, 0.224f0, 0.225f0)
tfm = CenterResizeCrop((224, 224)) |> ImageToTensor() |> Normalize(mean, std)
input = apply(tfm, Image(img))               # apply DataAugmentation transform
input = reshape(input.data, 224, 224, 3, :)  # unpack data and add batch dimension

# Run XAI method
composite = EpsilonPlusFlat()
analyzer = LRP(model, composite)
expl = analyze(input, analyzer)  # or: expl = analyzer(input)
heatmap(expl)                    # show heatmap using VisionHeatmaps.jl
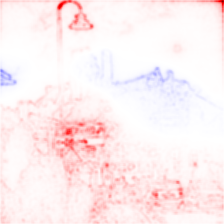
We can also get an explanation for the activation of the output neuron
corresponding to the "street sign" class by specifying the corresponding output neuron position 920:
analyze(input, analyzer, 920) Heatmaps for all implemented analyzers are shown in the following table. Red color indicate regions of positive relevance towards the selected class, whereas regions in blue are of negative relevance.
Adrian Hill acknowledges support by the Federal Ministry of Education and Research (BMBF) for the Berlin Institute for the Foundations of Learning and Data (BIFOLD) (01IS18037A).


