Trace data visualization with D3js
Finding CPU bottle neck is a usual tasks of performance analysis. One of the efficient way of finding the hot-path is to sampling stack trace of the system. However, it is difficult to read collected stack trace text data just as it is, because usually text trace data consists of enourmous amount of data.
To solve the problem, making trace data human readable with visualization is a good solution. D3js_trace visualize the sampled stack trace data with D3js. D3js is a JavaScript library for manipulating documents based on data. By visualizing trace data with HTML, SVG and CSS, we can easily detect where the CPU bottle neck is.
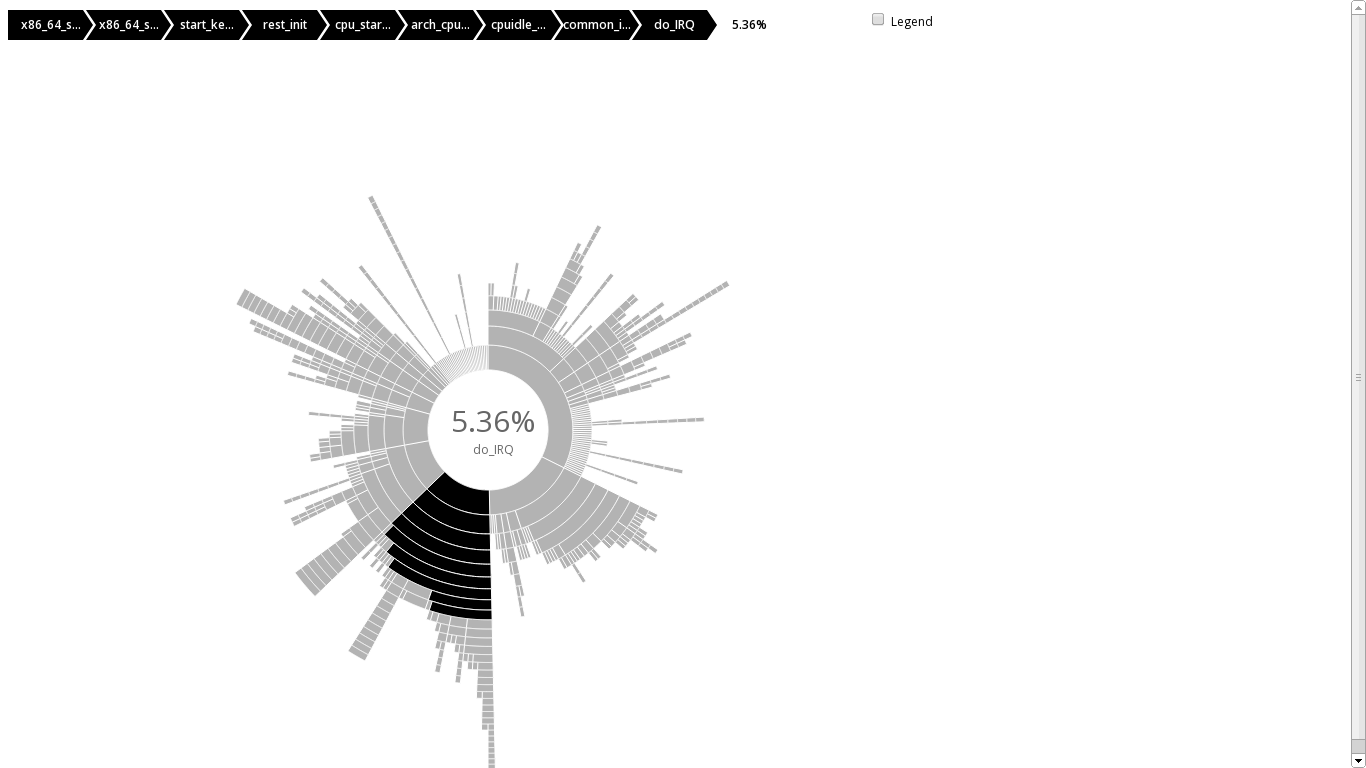
The following image is the visualized stack traces sampled with 'perf'. perf is a performance counters subsystem in Linux. They form a basis for profiling applications to trace dynamic control flow and identify hot-spots.
Here 'sunburst' form is used. A sunburst is similar to the treemap, except it uses a radial layout. The root node of the tree is at the center, with leaves on the circumference. The area (or angle, depending on implementation) of each arc corresponds to its occurrence count.
Interactive WEB page example is also available at HERE.
Clone the repository:
# git clone https://github.com/Etsukata/d3js_trace.git
# cd d3js_trace
First, we need to sampling stack traces. d3js_trace uses Linux 'perf' command to sample stack traces. This can be done with the following command:
# perf record -g fp -a sleep 3
Translate sampled trace to json for visualizing it with D3js:
# perf script | ./d3trace.py > trace_json.js
View HTML file with WEB browser:
# firefox index.html
d3js_trace is very impressed by the following great job.
- Brendan Gregg's FlameGraph visualize hot-CPU code-paths.
And using the following D3js example for visualization.
- D3js example: Sequences sunburst
- Show stack traces with colors
- Make sunburst trace graph zoomable
- Visualize with other d3js tools(Collapsible Tree, Zoomable Pack, and more)
- Visualize latency trace data collected with ftrace
