Debugging LLVM JIT code inside Visual Studio with PDB
Just copy/paste the content inside your LLVM root path and add JITPDB in {LLVM_ROOT}/lib/CMakeLists.txt and {LLVM_ROOT}/lib/LLVMBuild.txt so that CMAKE configuration adds the LLVMJITPDB project to the LLVM solution (repeat that for the HowToUseJITWithPDB folder)
I assume you already know what is a MemoryManager inside LLVM and its JIT systems (MCJIT / OrcJIT). If not, follow the Kaleidoscope JIT Tutorial on LLVM.
Just create a JITPDBMemoryManager and use it either in your MCJIT or OrcJit setup. (I've only tried MCJIT right now, please let me know if something doesn't work with OrcJIT, the project is quite young).
// using embedded dll and pdb templates :
auto MemMgr = std::make_unique<JITPDBMemoryManager>("MyModule.pdb", "", [](void* EmittedDllBaseAddress)
  {
    printf("MyModule.dll has been loaded at 0x%p and is now debuggable", EmittedDllBaseAddress);
  }
);

// using jitmem.pdb[.dll] generated by jitmemgen.exe (can be renamed if you want) :
auto MemMgr = std::make_unique<JITPDBMemoryManager>("MyModule.pdb", "MyPath/jitmem.pdb", [](void* EmittedDllBaseAddress)
  {
    printf("MyModule.dll has been loaded at 0x%p and is now debuggable", EmittedDllBaseAddress);
  }
);
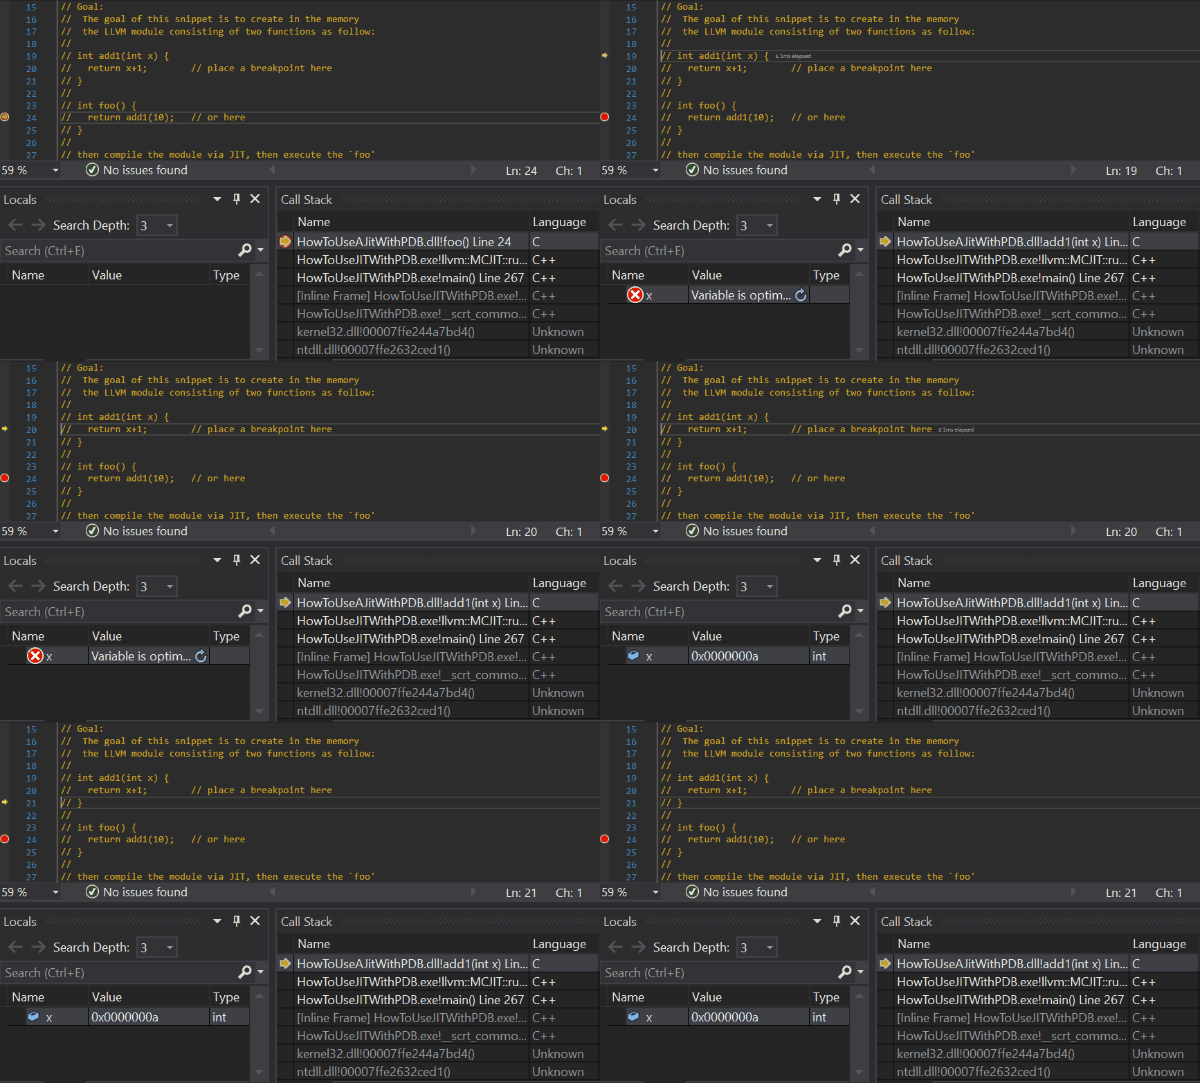
See HowToUseJitWithPDB.cpp in the examples folder for complete working sample/tutorial. In this example you can put breakpoint inside the comment code description and see visual studio break into it. It will also give you some hint on how to use correctly IR and the DIBuilder together to generate your debug infos properly.
LLVM Jit Pdb works like this :
- a dummy .dll is written from C++ embedded data to the disk (along the .pdb user path) and loaded.
- Jitted code is allocated directly inside dll image (write access have been allowed)
- PDB is generated based on the COFFObjectFile emitted by the llvm RuntimeDyld engine.
- Dll is unloaded with a memory backup on ram.
- Dll is written/hacked on disk for various stuff (pdb matching, guid, timestamp, code sections, unwind infos, access rights).
- Dll is reloaded with everything coming back at the same VirtualSpace it has been written (by chance).
- This triggers PDB loading inside visual studio and a great C++/Script interleaved debug experience.
The embedded .dll and .pdb data have limitation in size for now as I'm not an expert in creating .dll from scratch. The limitation is around 8MB for code and 8MB for data. It might seem little, but I personnally only reach 9% of code and 8% data on my personal project which is a game editor.You can enable the Verbose property on the memory manager to follow your memory consumption.
First, check that indeed everything in the DIBuilder has been setup correctly :
- calls of llvm::Function::setSubprogram
- calls of llvm::IRBuilder::SetCurrentDebugLocation (with valid DebugLoc)
- valid DIFile with generated MD5 checksums (see example)
Then ensure that llvm::Module::addModuleFlag(Warning, "CodeView", 1) is invoked on your Module (by default LLVM uses DWARF as DebugInfo format and PDB only embeds CodeView). You might also need to explicitely set the target on your Module. You can look at HowToUseJITWithPDB example for full steps.
Finally, you can check both the JITPDBMemoryManager::Status and console output for better information on what is going on.
A new tool called "jitmemgen.exe" is available for you to generate your own EMBEDDED_DLL.cpp and EMBEDDED_PDB.cpp (if you want to replace the default embedded memory in this repo) and standalone .pdb/.dll/.hck (if you want to use standalone files as memory templates). By default embedded data provides approximately 16MB (8MB for code, 8MB for data). See "jitmemgen.exe" usage.
But my personal advices would be :
If your data reaches the limit, I would try to replace static allocations by some heap allocations (when it comes to JIT, we are generally not that picky on where memory is).
If your code reaches the limit, my advice would be (not only for the JIT, but in your life in general) to split your code into different reusable JIT modules (and so multiple JITPDBMemoryManager with 16MB memory each). As I said my biggest module reaches only 9% of 8MB in my personal project and I'm really confident for the future as I like to split stuff into specialized Modules for clarity. Another way to get around that, more advanced but a cool feature, is to transpile your most stable code to native code.
You can help me support this project and my other project https://github.com/vlmillet/phantom on my baby patreon :)) https://www.patreon.com/vlmillet
