K-means clustering aims to partition n observations into K clusters in which each observation belongs to the cluster with the nearest mean, serving as a prototype of the cluster.
The result of a cluster analysis shown below as the coloring of the squares into three clusters.
Given a training set of observations:
Where each observation is a d-dimensional real vector, k-means clustering aims to partition the m observations into K (≤ m) clusters:
... so as to minimize the within-cluster sum of squares (i.e. variance).
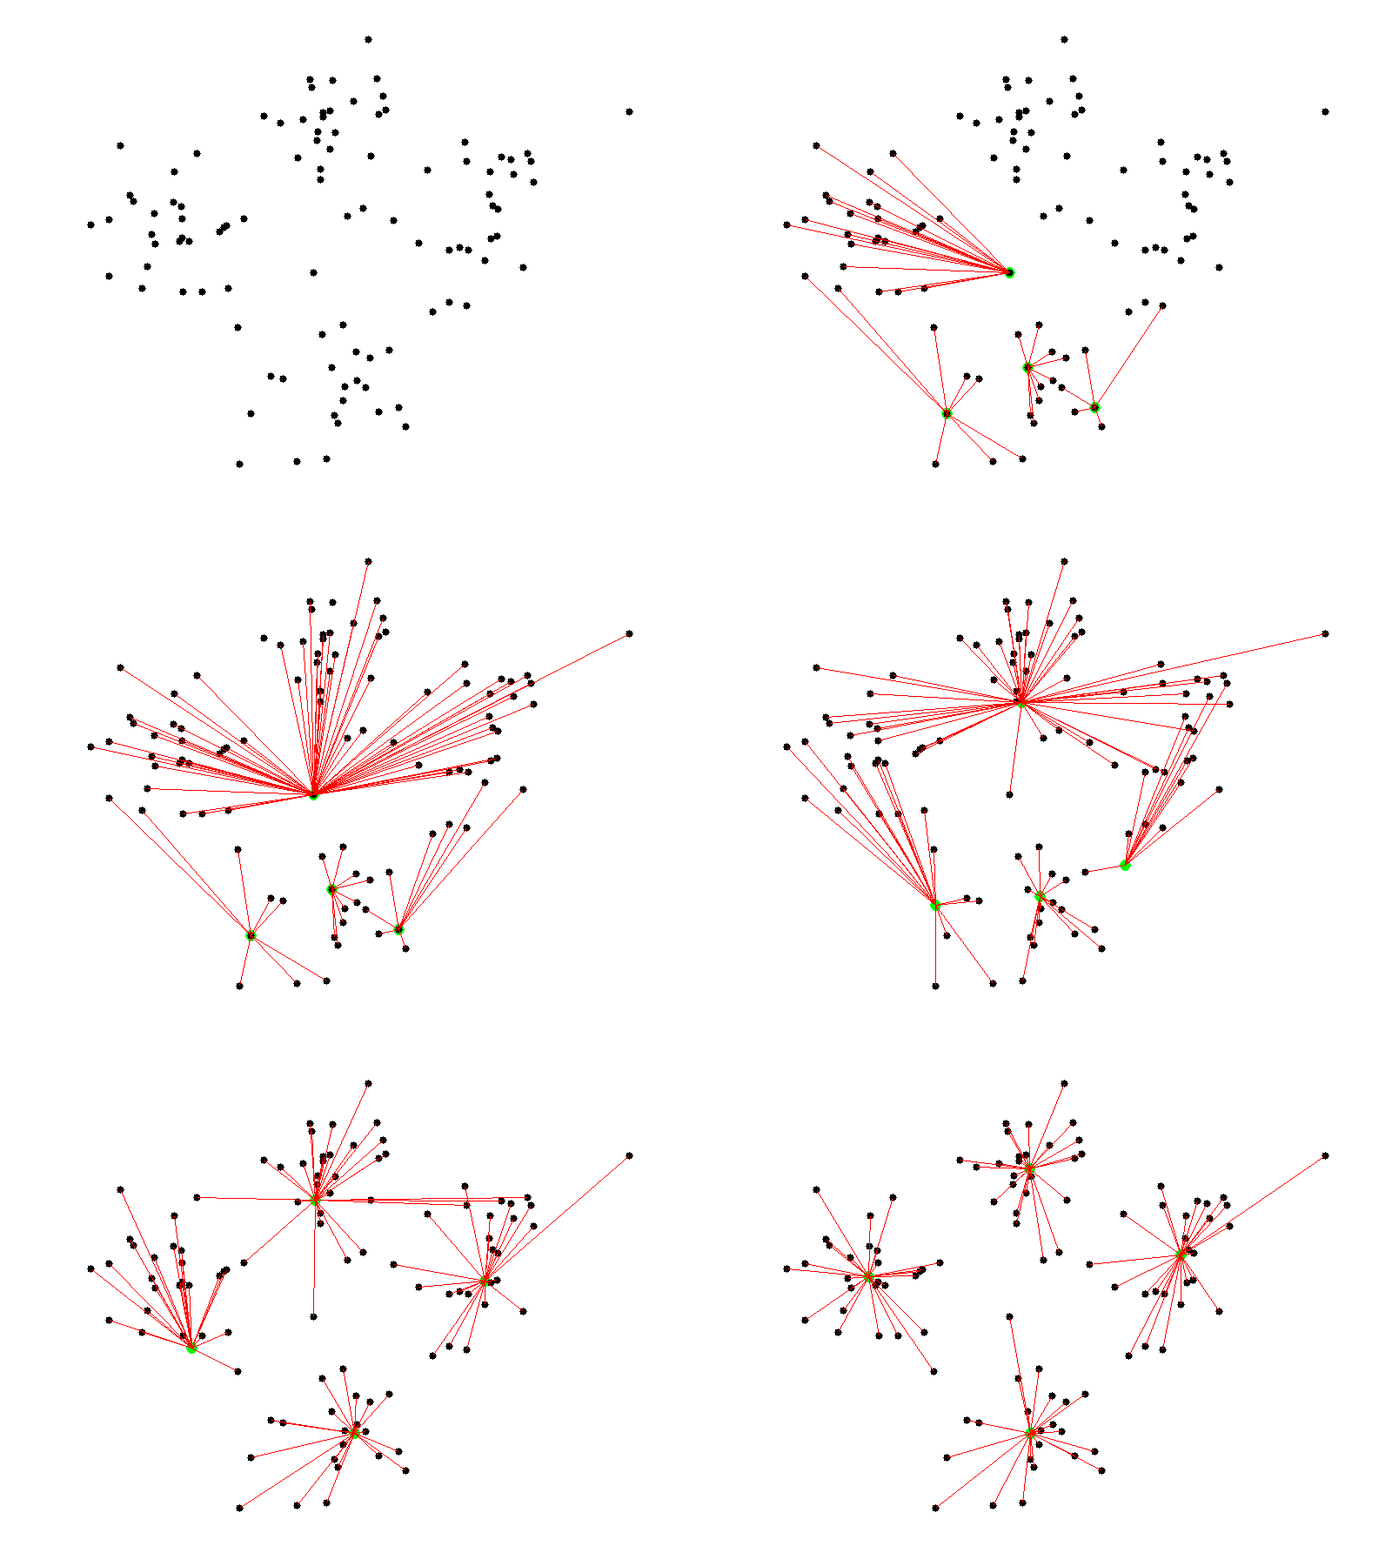
Below you may find an example of 4 random cluster centroids initialization and further clusters convergence:
Another illustration of k-means convergence:
- index of cluster (1, 2, ..., K) to which example x(i) is currently assigned.
- cluster centroid of a cluster to which the example x(i) has been assigned.
For example:
In this case optimization objective will look like the following:
Randomly initialize K cluster centroids (randomly pick K training examples and set K cluster centroids to that examples).
- demo.m - main demo file that you should run from Octave console.
- set1.mat - training data set #1.
- set2.mat - training data set #2.
- compute_centroids.m - compute the next mean centroid for each cluster.
- find_closest_centroids.m - split training examples into cluster based on the distance to centroids.
- init_centroids.m - randomly init centroids by taking random training examples.
- k_means_train.m - function that runs K-Means algorithm.


