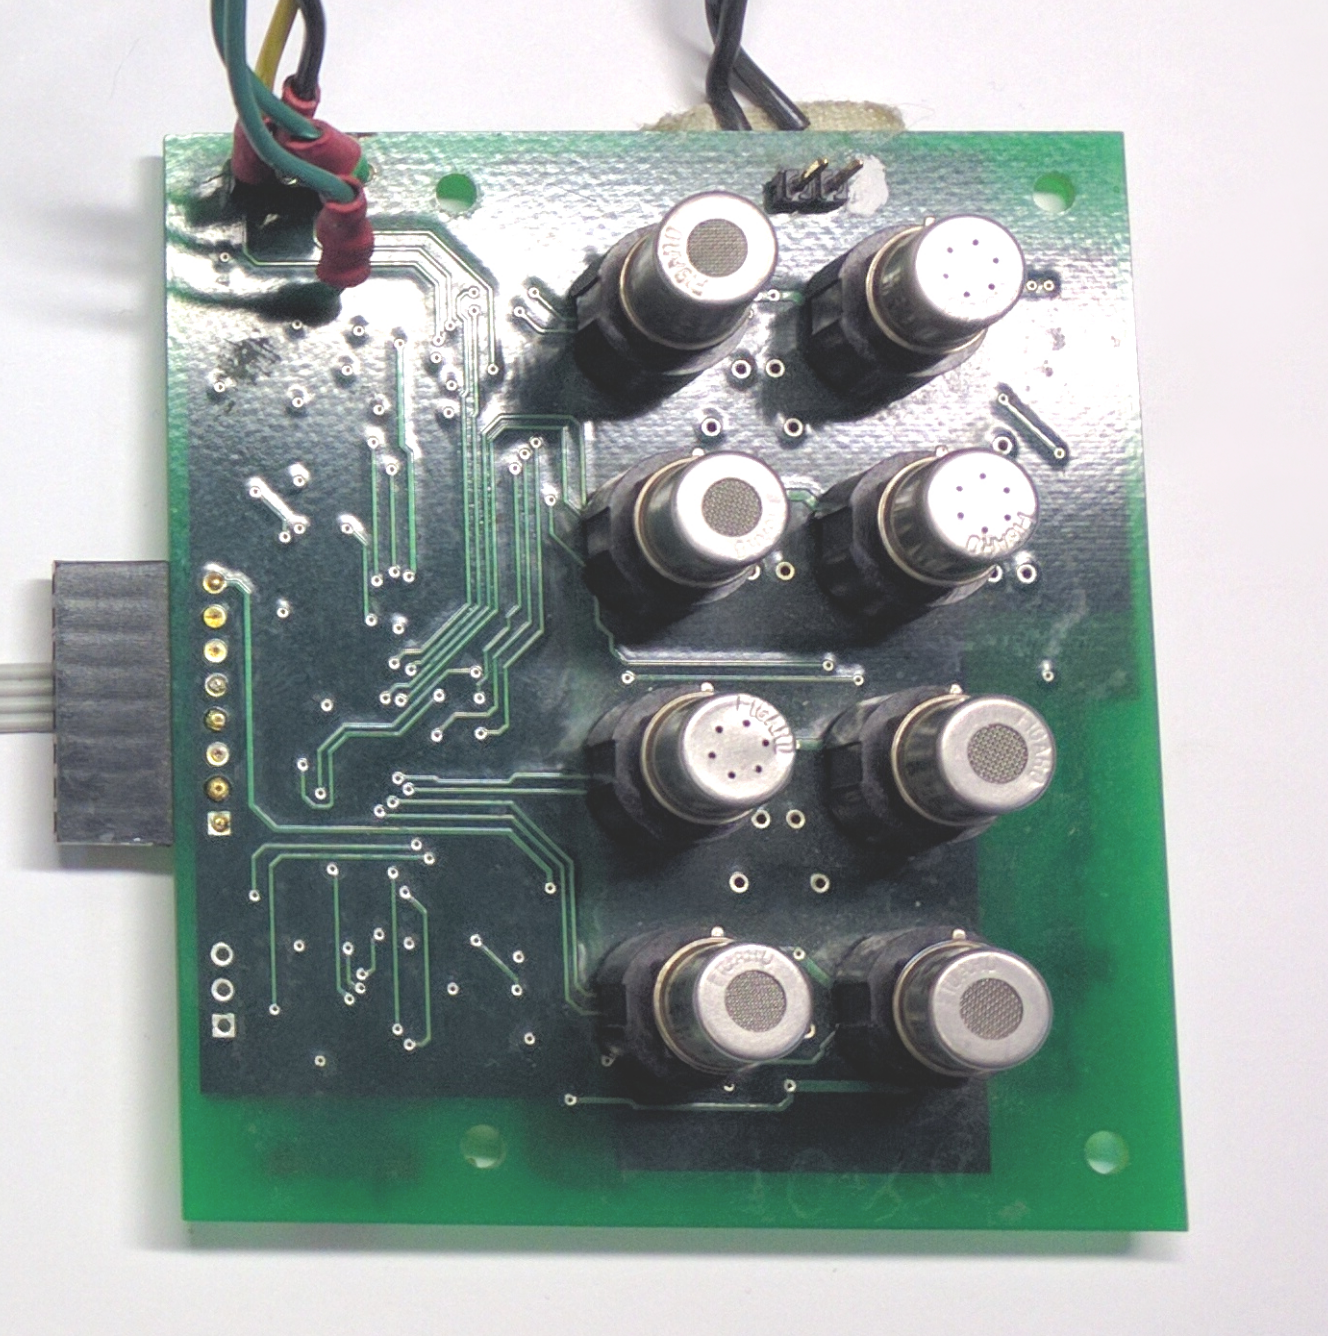
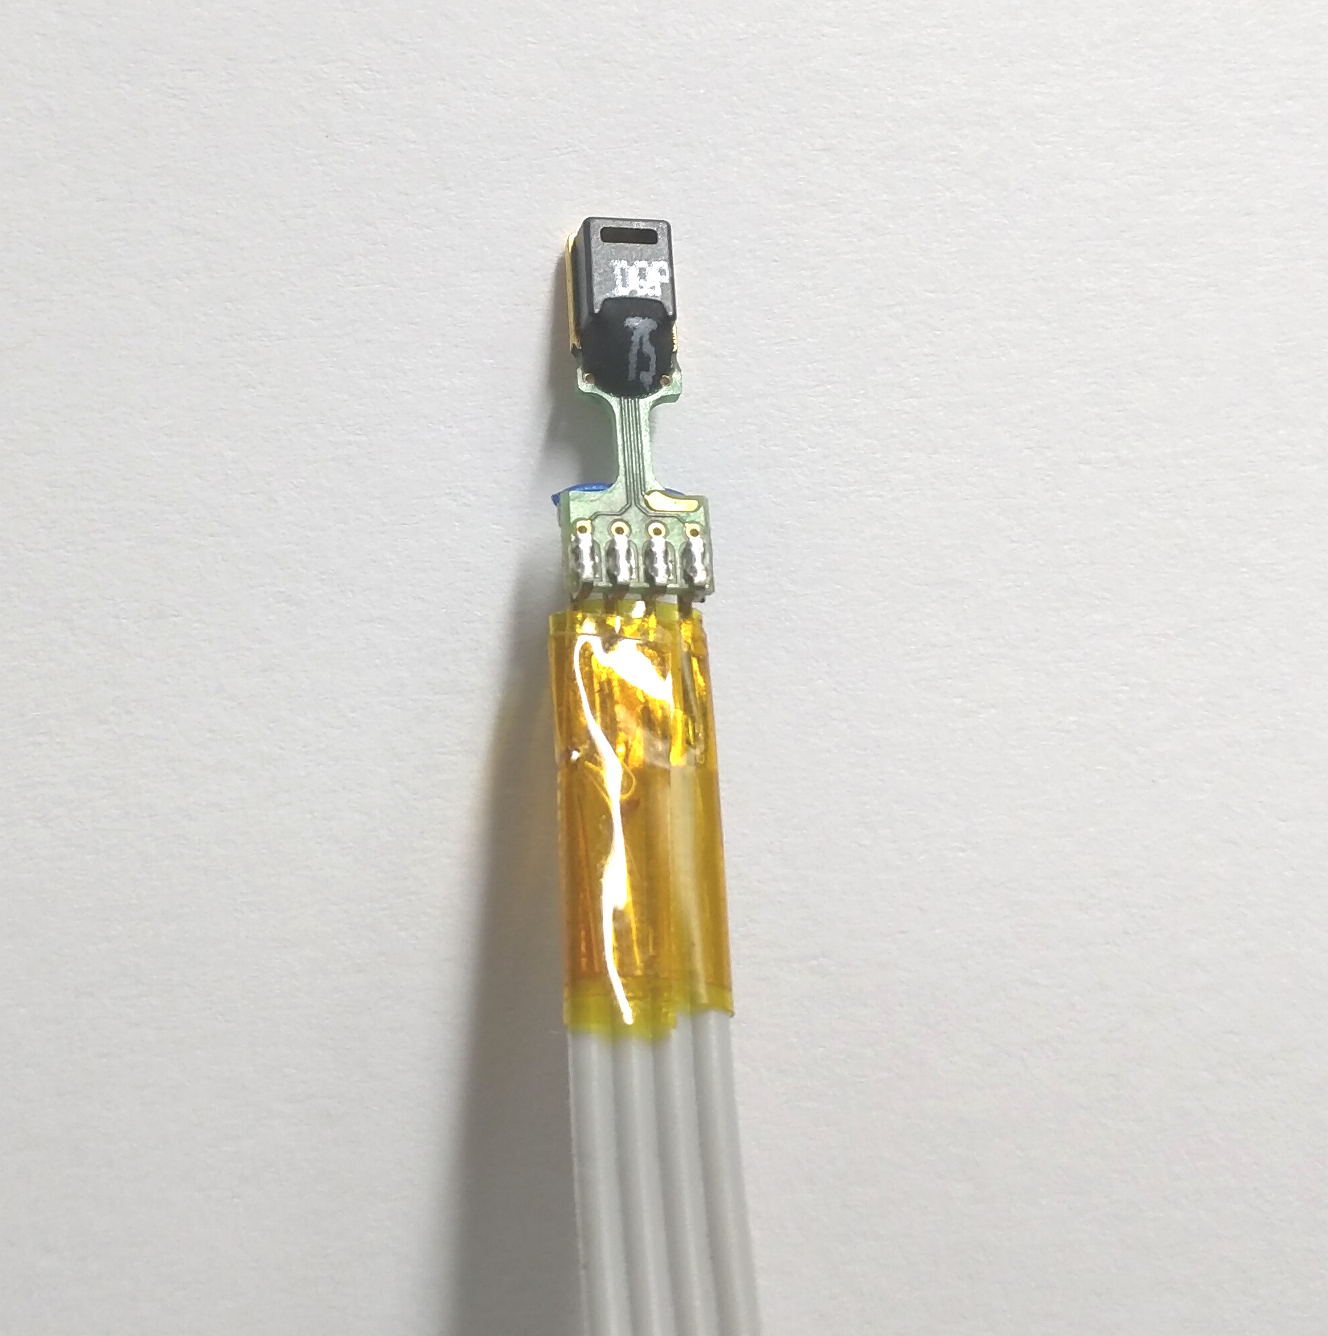
In this repository, you will find snippets of code to exemplify how to import, organize and plot data from a recently published paper where we propose a method for decorrelating humidity and temperature from signals of MOX gas sensors. In particular, the code in this repository reproduces figure 7 and first line in table 3. The dataset is publicly available at UCI Machine Learning repository and contains recordings of a gas sensor array (picture below) composed of 8 MOX gas sensors, and a temperature and humidity sensor. This sensor array was exposed to background home activity while subject to two different stimuli: wine and banana. The responses to banana and wine stimuli were recorded by placing the stimulus close to the sensors. The duration of each stimulation varied from 7min to 2h, with an average duration of 42min. This dataset contains a set of time series from three different conditions: wine, banana and background activity. There are 36 inductions with wine, 33 with banana and 31 recordings of background activity. One possible application is to discriminate among background, wine and banana.
The dataset is publicly available at UCI Machine Learning repository, and contains recordings of a gas sensor array (see picture above). We kindly request that you cite our paper if you use our dataset (see Relevant papers below). The size of the zipped dataset is 28MB.
If you find this useful, please star this repository and/or cite our paper:
Ramon Huerta, Thiago Mosqueiro, Jordi Fonollosa, Nikolai Rulkov, Irene Rodriguez-Lujan. Online Decorrelation of Humidity and Temperature in Chemical Sensors for Continuous Monitoring. Chemometrics and Intelligent Laboratory Systems 2016.
For a quick & dirty example for loading our dataset in python, only numpy is necessary. Assuming that the dataset files are in the same folder, the snippet below is enough to load the data.
import numpy as np

## Importing dataset
metadata = np.loadtxt('HT_Sensor_metadata.dat', skiprows=1, dtype=str)

## Loading the dataset
dataset = np.loadtxt('HT_Sensor_dataset.dat', skiprows=1)
Then, variable metadata has all the metadata, and dataset has the actual recordings. Because file HT_Sensor_dataset.dat is 108MB, it may take a few seconds to load it (in an Intel i7 3.2GHz, it takes about 17 seconds). The time series of induction with a given id, say 17, you can use the following piece of code:
id = 17.
timeSeries = dataset[ dataset[:,0] == id, 1:]
The 1 in "1:" above removes the column with id, leaving variable timeSeries with only data from the recording with id 17.
Ramon Huerta, BioCircuits Institute, University of California San Diego
Thiago Mosqueiro, BioCircuits Institute, University of California San Diego
Jordi Fonollosa, Institute for Bioengineering of Catalunya & University of Barcelona
Nikolai Rulkov, BioCircuits Institute, University of California San Diego
Irene Rodriguez-Lujan, Escuela Politecnica Superior, Universidad Autonoma de Madrid
- Xuezhen (Tina) Hong, for reviewing and providing feedback on the code.
-
Dataset, which is available at UCI Machine Learning Repository
-
Python 2.*
-
numpy 11.*+
-
matplotlib 1.10+
tl;dr version: please, don't sue me and ship a copy of the License file with any derived product. Read License file for the actual terms.

