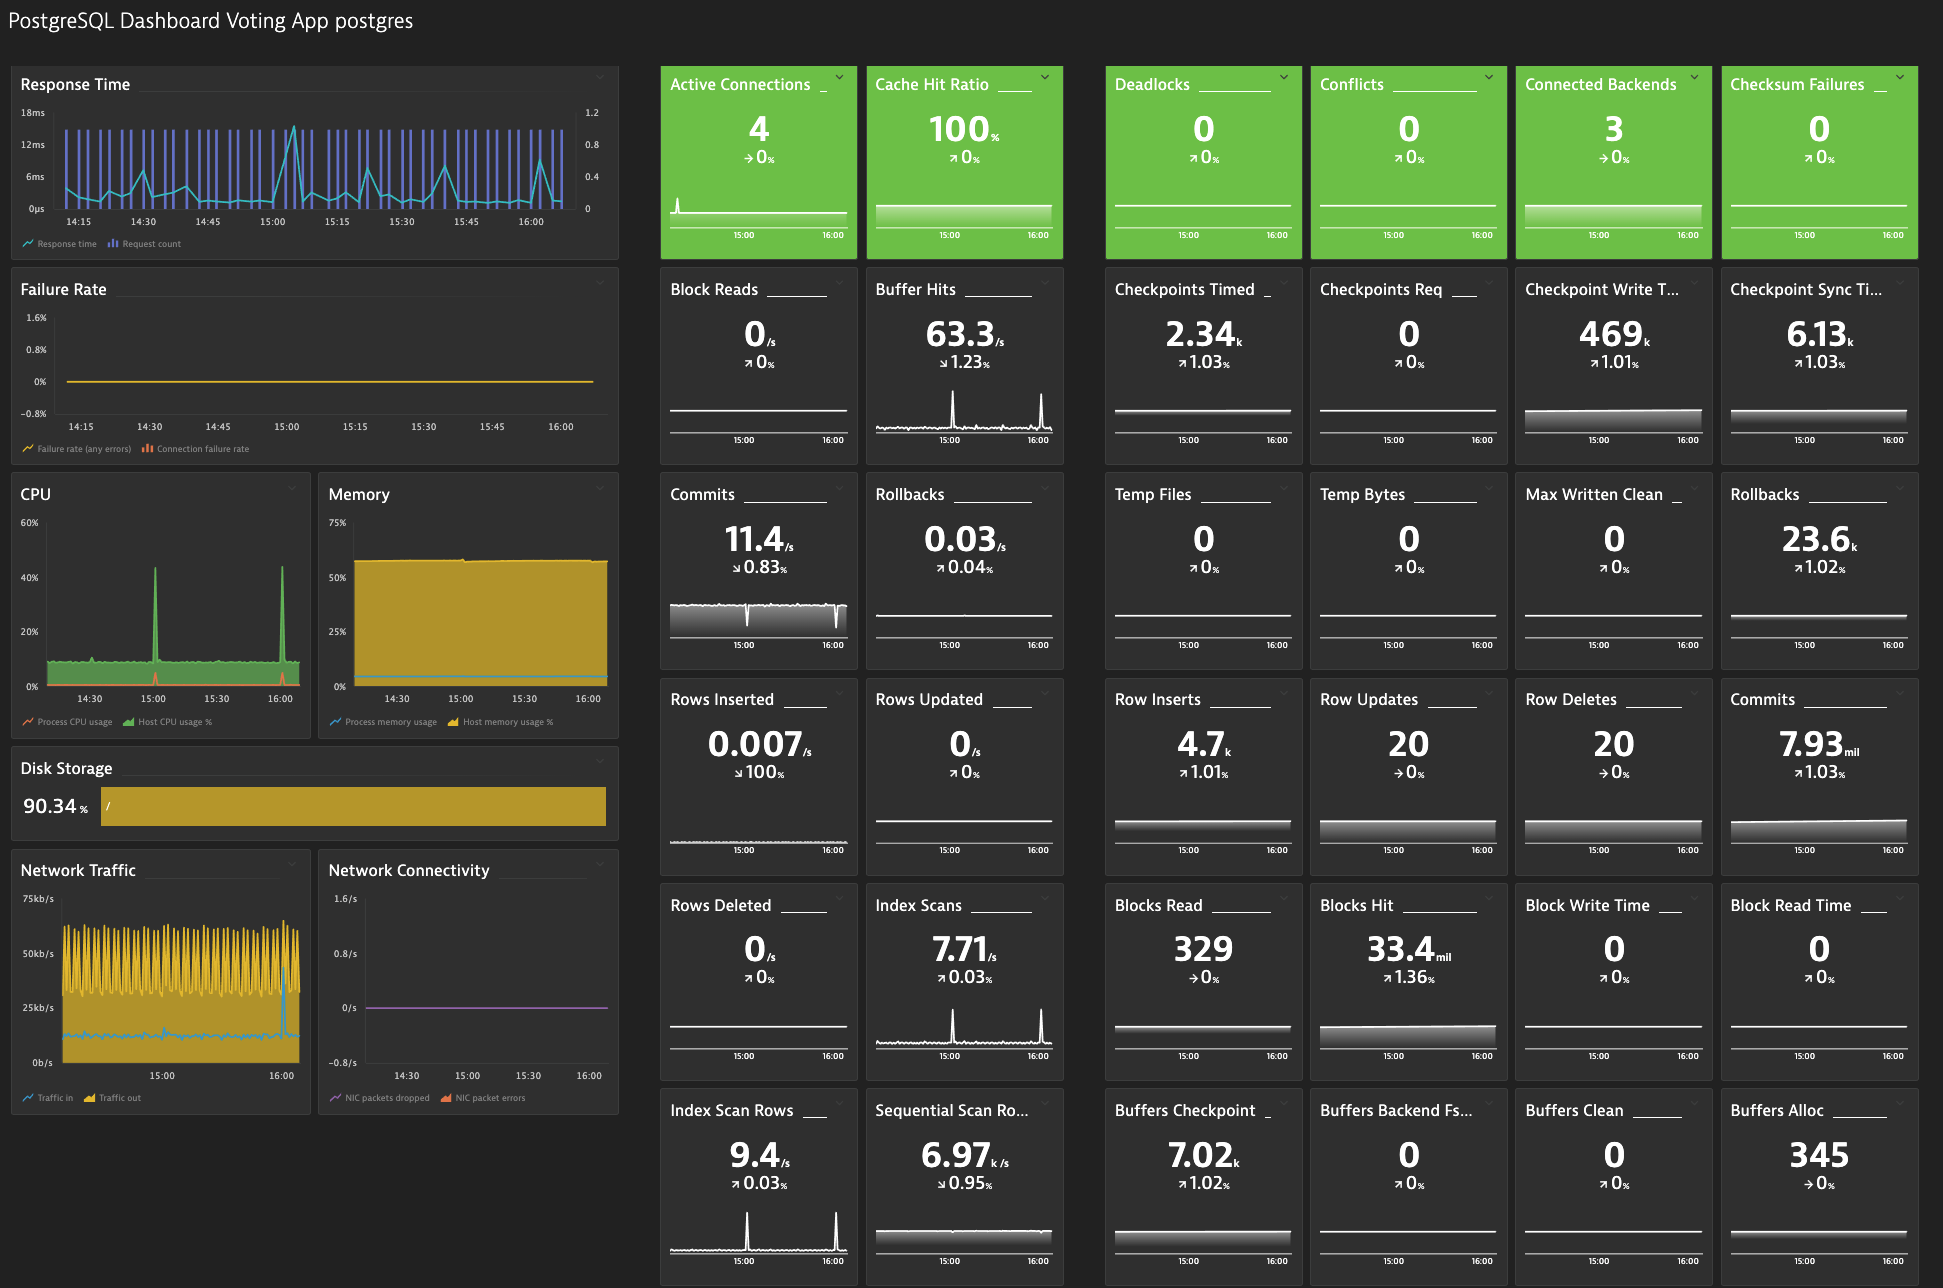
This is a dashboard that presents the PostgreSQL (postgres) metrics collected by Dynatrace across the various hosting platforms. Metrics are obtained via OneAgent, Telegraf, and the appropriate cloud provider integration.
https://www.dynatrace.com/hub/?query=postgresql
Developed and tested on Dynatrace v1.231.
In this scenario, you are hosting the postgres database engine and have access to deploy the Dynatrace OneAgent on the postgres server/host.
- https://docs.influxdata.com/telegraf/v1.20/introduction/installation/
- https://github.com/influxdata/telegraf/tree/master/plugins/inputs/postgresql
- https://github.com/influxdata/telegraf/tree/master/plugins/outputs/dynatrace
In this scenario, the postgres database is hosted in AWS, via the Relational Database Server (RDS) cloud native service.
Deploy Telegraf on one (or more) of the upstream application hosts calling the database (if not applicable, install on any host supported by Telegraf)
- https://docs.influxdata.com/telegraf/v1.20/introduction/installation/
- https://github.com/influxdata/telegraf/tree/master/plugins/inputs/postgresql
- https://github.com/influxdata/telegraf/tree/master/plugins/outputs/dynatrace
In this scenario, the postgres database is hosted in Azure, via the Azure Database for PostgreSQL server cloud native service.
Deploy Telegraf on one (or more) of the upstream application hosts calling the database (if not applicable, install on any host supported by Telegraf)
- https://docs.influxdata.com/telegraf/v1.20/introduction/installation/
- https://github.com/influxdata/telegraf/tree/master/plugins/inputs/postgresql
- https://github.com/influxdata/telegraf/tree/master/plugins/outputs/dynatrace
The Dynatrace output plugin for Telegraf has a configuration setting "prefix" that is added to the beginning of the metric identifier. The prefix itself should not contain a trailing .. This workflow requires a trailing . when deploying the dashboard. If you set the prefix to "telegraf.postgres" in your Telegraf configuration, you would enter "telegraf.postgres." into this workflow when deploying the dashboard.
Here are some example configurations for the Telegraf postgresql input plugin address field. The Telegraf agent can monitor local or remote postgres databases (with the necessary firewall rules in place).
- Local:
address = "postgres://<database-user>:<password>@<db-hostname>:<port>/<database-name>" - AWS RDS:
address = "postgres://<database-user>:<password>@<aws-rds-hostname>:<port>/<database-name>" - Azure DB:
address = "postgres://<database-user>@<azure-db-hostname>:<password>@<azure-db-hostname>:<port>/<database-name>"
For any issues or requests for enhancement, please open an Issue on the GitHub repo: https://github.com/popecruzdt/BizOpsConfiguratorPacks/issues
