This is a collection of configurations and dashboards for integrating and analyzing load tests in Dynatrace.
https://www.dynatrace.com/support/help/shortlink/load-testing-process
Developed and tested on Dynatrace v1.222.
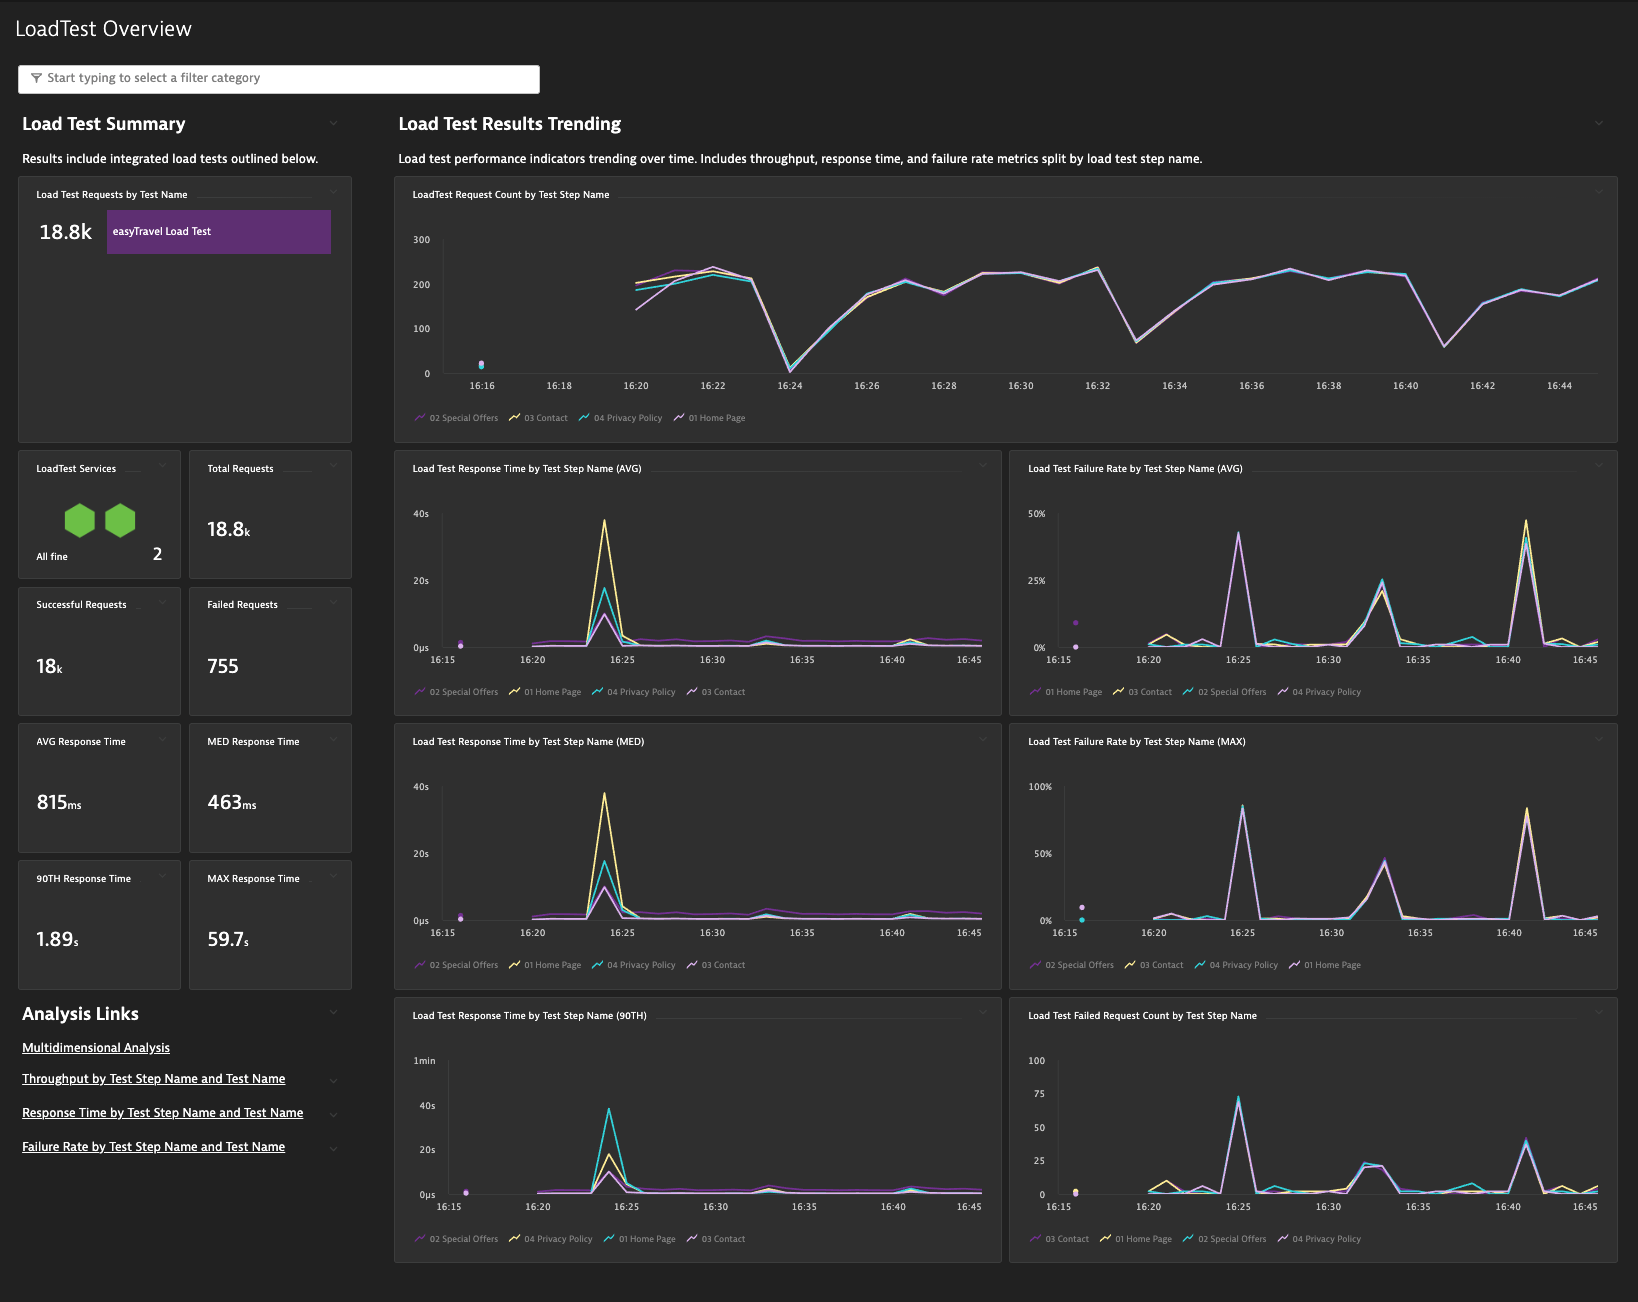
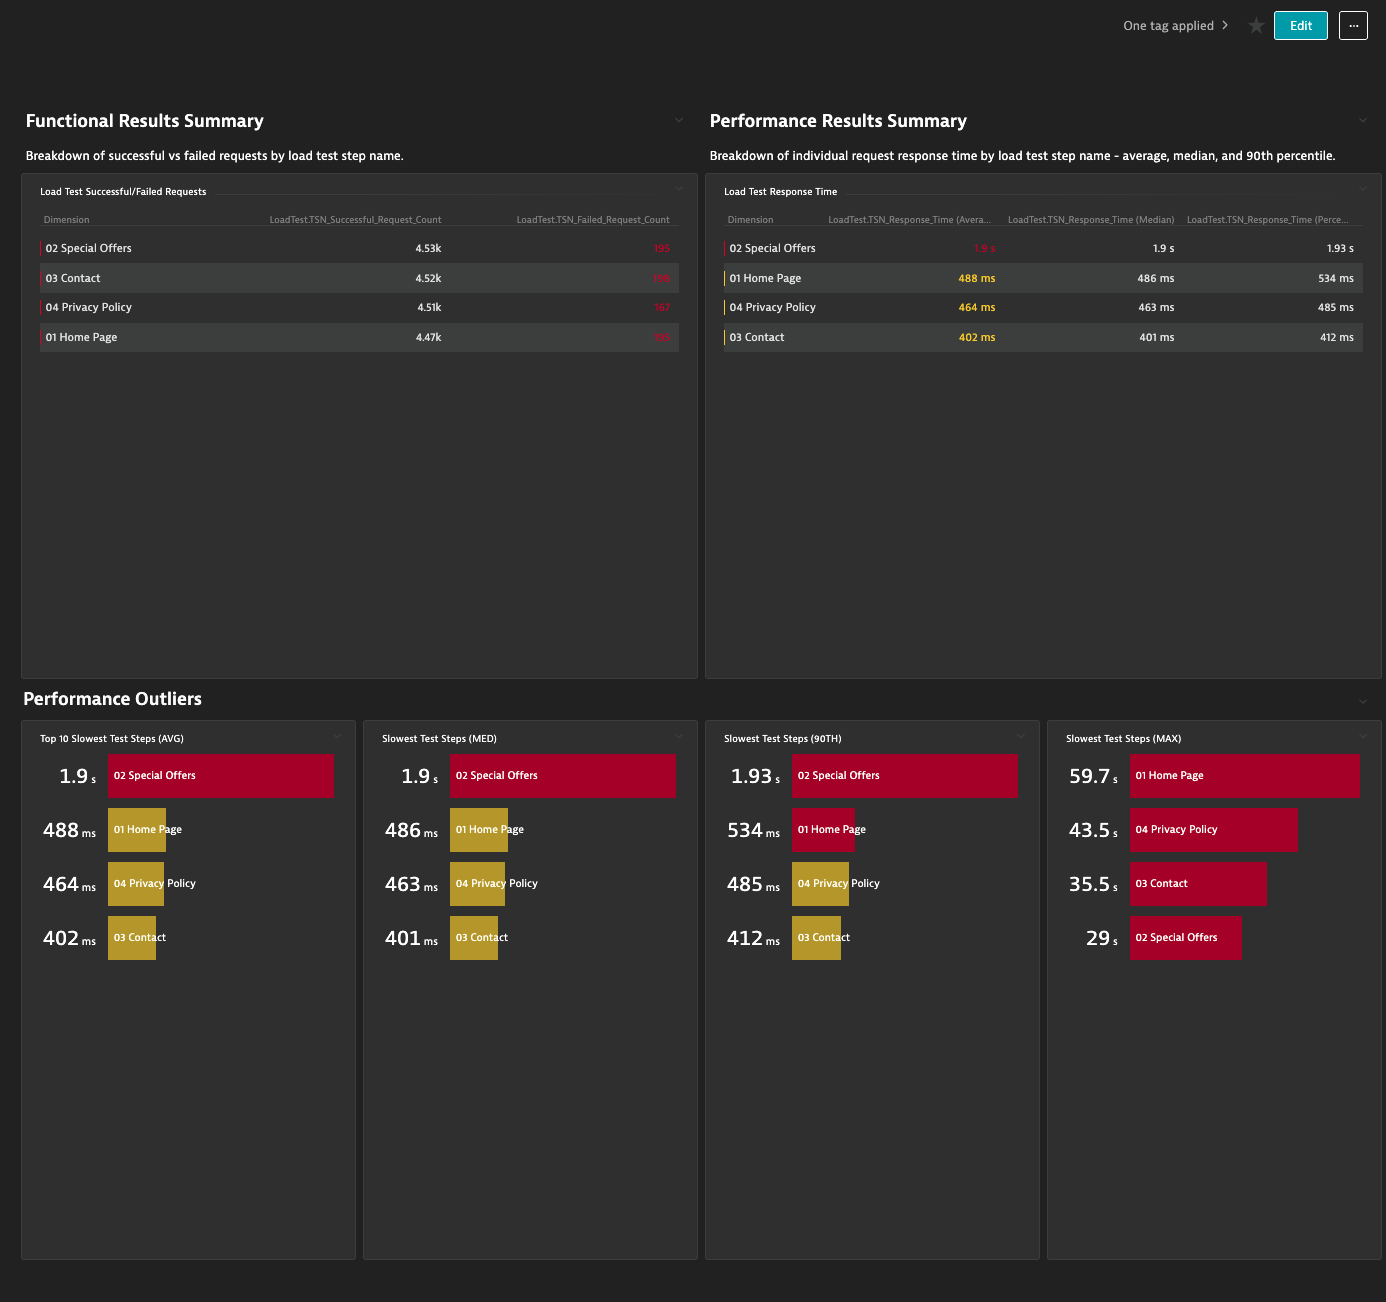
This dashboard displays the functional and performance metrics captured for load tests that are integrated using the x-dynatrace-test HTTP header.
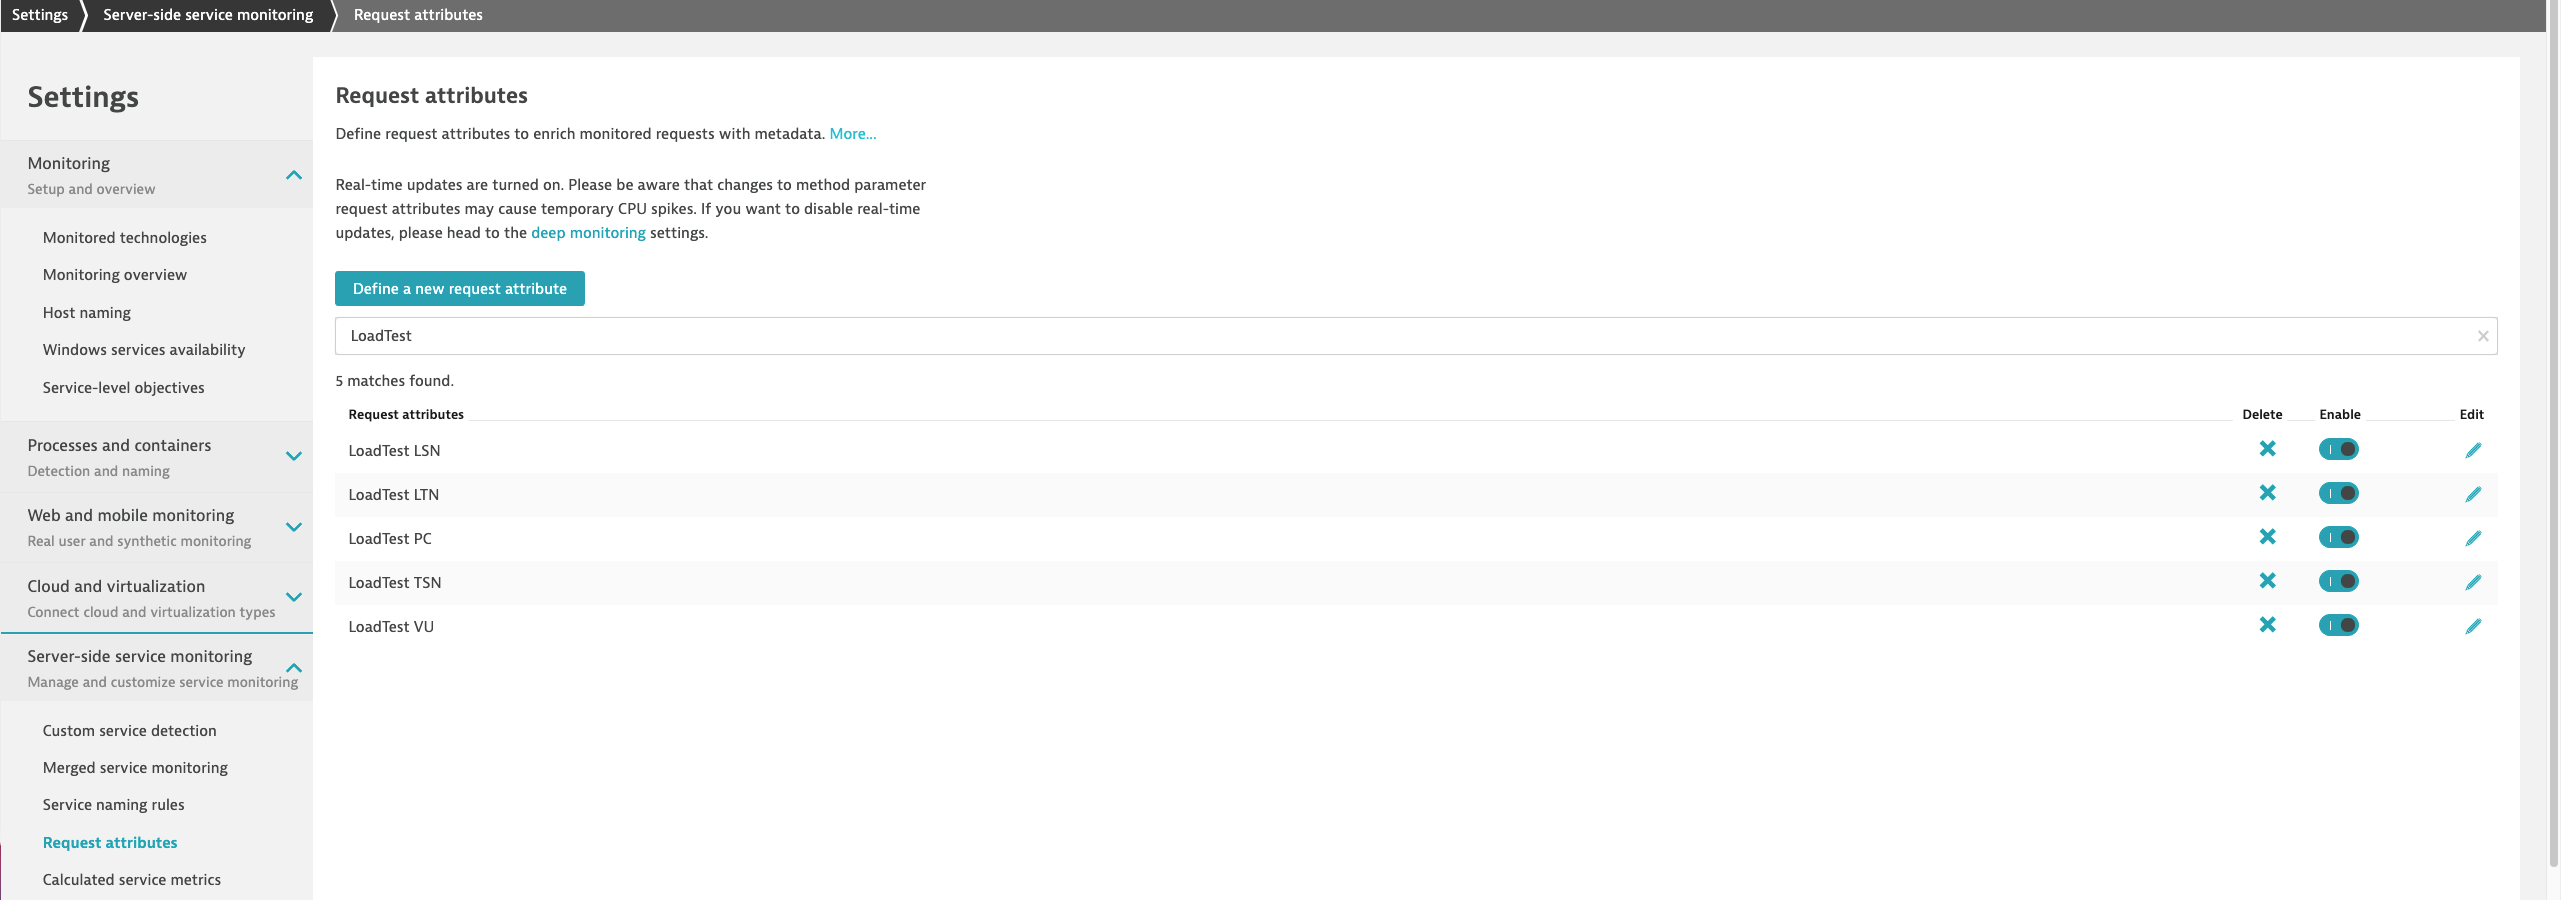
Upload the Request Attribute configurations to capture the load test metadata. These should be uploaded first.

Upload the Automatic Tag configurations to tag the services that will be load tested. These should be uploaded second. Custom metrics will only be calculated for Services that are tagged.

The Automatic Tag includes a placeholder rule. This rule should do nothing. Replace this rule with one that matches the Services that will be included in the load test. It is recommended to use Tag Values to split out different load test groups (for example, by application environment).
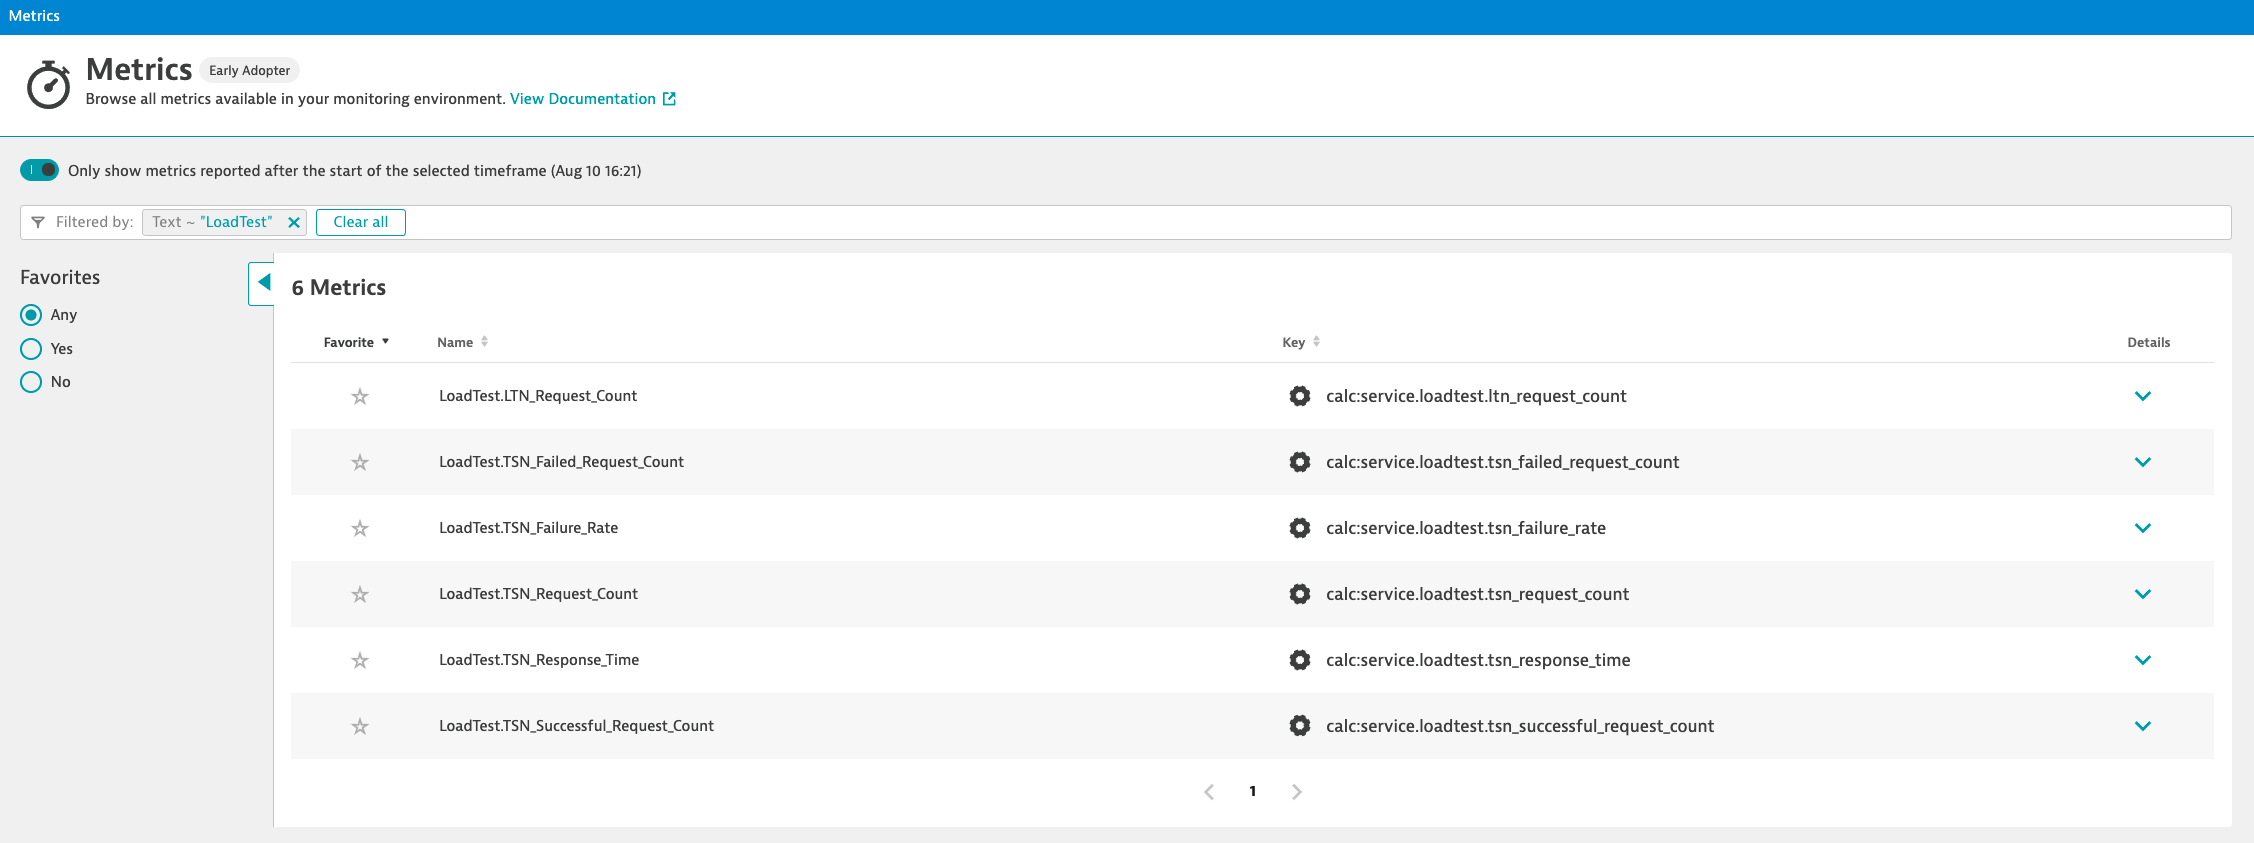
Upload the Custom (Calculated Service) Metrics configurations to capture the load test metrics for the load test metadata. These should be uploaded third. These metrics depend on the Request Attributes and Automatic Tag(s).

Note: Adding custom metrics may result in additional DDU license consumption: https://www.dynatrace.com/support/help/shortlink/metric-cost-calculation
For any issues or requests for enhancement, please open an Issue on the GitHub repo: https://github.com/popecruzdt/BizOpsConfiguratorPacks/issues

