-
Notifications
You must be signed in to change notification settings - Fork 0
Logs through Loki
Pull logs using Promtail
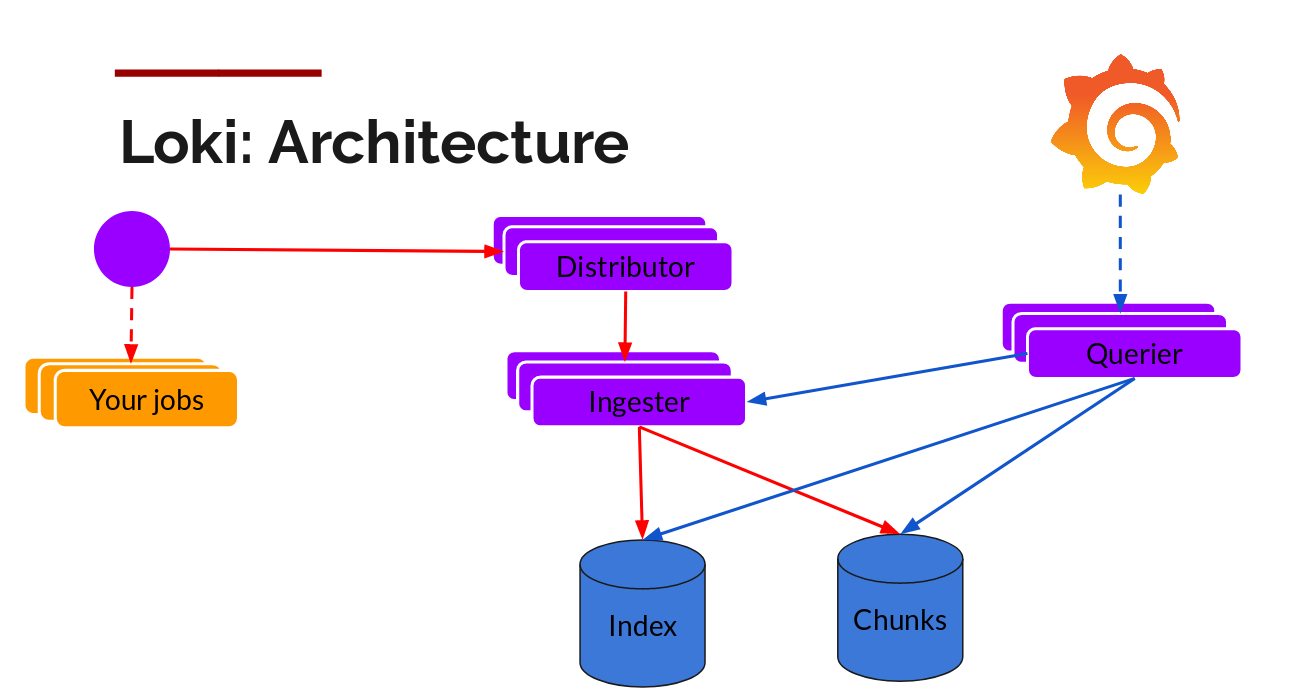
We are collecting logs through an exporter into the Loki server that runs as a docker container through Nomad. The method offers:
- Inclusive monitoring where all aspects of systems are monitored and available to provide insight and drive decisions.
- Raw log messages including generic system and application specific
- Time series data parsed from log message payload
- Flexible Query language
- Logs have metadata:
Promtail uses docker plugin to scrape container logs
sudo docker plugin install grafana/loki-docker-driver:latest --alias loki --grant-all-permissions
- If installing on new node perform
SIGHUPafter
sudo kill -SIGHUP $(pid of dockerd)
Promtail uses pipeline to parse data: -https://github.com/grafana/loki/blob/v1.3.0/docs/clients/promtail/pipelines.md
Data is stored as indexed data and chunk -https://github.com/grafana/loki/tree/master/docs/operations/storage
Example log message from web_app:
{"log":"2020-04-06 01:10:45,735 - event_writer - INFO - {\"messages\": 15387, \"buffer\": 0, \"sets\": 15387,
 \"events\": 15387, \"in\": 784.7193815521896, \"rate\": 39.216566741512686, \"reconnects\":
1}\n","stream":"stderr","time":"2020-04-06T01:10:45.73571913Z"}
Current pipeline for web_app logs:
  pipeline_stages:
  - match:
      selector: '{app="web_app"} |~ "- [A-Z]+ -"'
      stages:
      - regex:
          expression: '^(?s)[^0-9]+(?P<time>[^ ]+ [^ ]+)[^a-z]+(?P<service>\S+)[ |-]+(?P<level>\S+)[ |-]+(?P<payload>.*)$'
      - labels:
          service:
          level:
      - output:
          source: payload

- Alerting
- Pull based monitoring, so it’s easy to run locally for testing
Are tools and applications that expose a metric endpoint to Prometheus to scrape from. For our environment, we are using the following exporters:
- Promtail: Scrapes containers and nodes for changes in files, monitors stdout, stderr.
Labels are stored in an index database for quick queries and alerts
Chunk data (all ether data) is stored in a NoSQL database for advances querying and troubleshooting
Metrics are stored in Prometheus' time-series database and are available to easily query to understand how these systems behave over time. The followings are different types of metrics available:
- Counters that are incremental value used to measure the number of requests, errors
- Gauges are the incremental or decremental value that changes over time to measure the number of a function call, CPU usage, memory usage, number of items processed, etc.
- Histograms are used for observing a value, time, duration. For instance, you can tell what percentage of requests took x amount of time *Summaries are samples observations while they also provide a total count of observations and a sum of all observed values.
Our Grafana instance is connected to Prometheus and Loki, and can be accessed at: http://grafana.pennsignals.uphs.upenn.edu/
As of now, we have two dashboards within Grafana:
- Minion Nodes that provides information about resources such as memory, disk, and CPU utilization.
- Container Performance that provides stats about each container.
Both of these dashboards are available to re-import into Grafana in JSON format at: https://github.com/pennsignals/metrics-and-logs/tree/master/grafana_dashboard
LogQL can be considered a distributed grep that aggregates log sources and using labels and operators for filtering.
There are two types of LogQL queries: log queries which return the contents of log lines, and metric queries which extend log queries and calculates values based on the counts of logs from a log query.

This is the query language available to Prometheus. In order to use PQL more effectively you need to look up available metrics in Prometheus dashboard located at: http://prometheus.pennsignals.uphs.upenn.edu/graph
Alert using Slack #grafana

- Add inline alert manager
- Identify labels to be captured for alerting and quick queries
- Identity metrics to be parsed and captured using Prometheus
- Identify Databases to store logs on (Index and Chunk). Azure?
- Integrate email to invite new users
- Use Penn Identity Server for authentication
