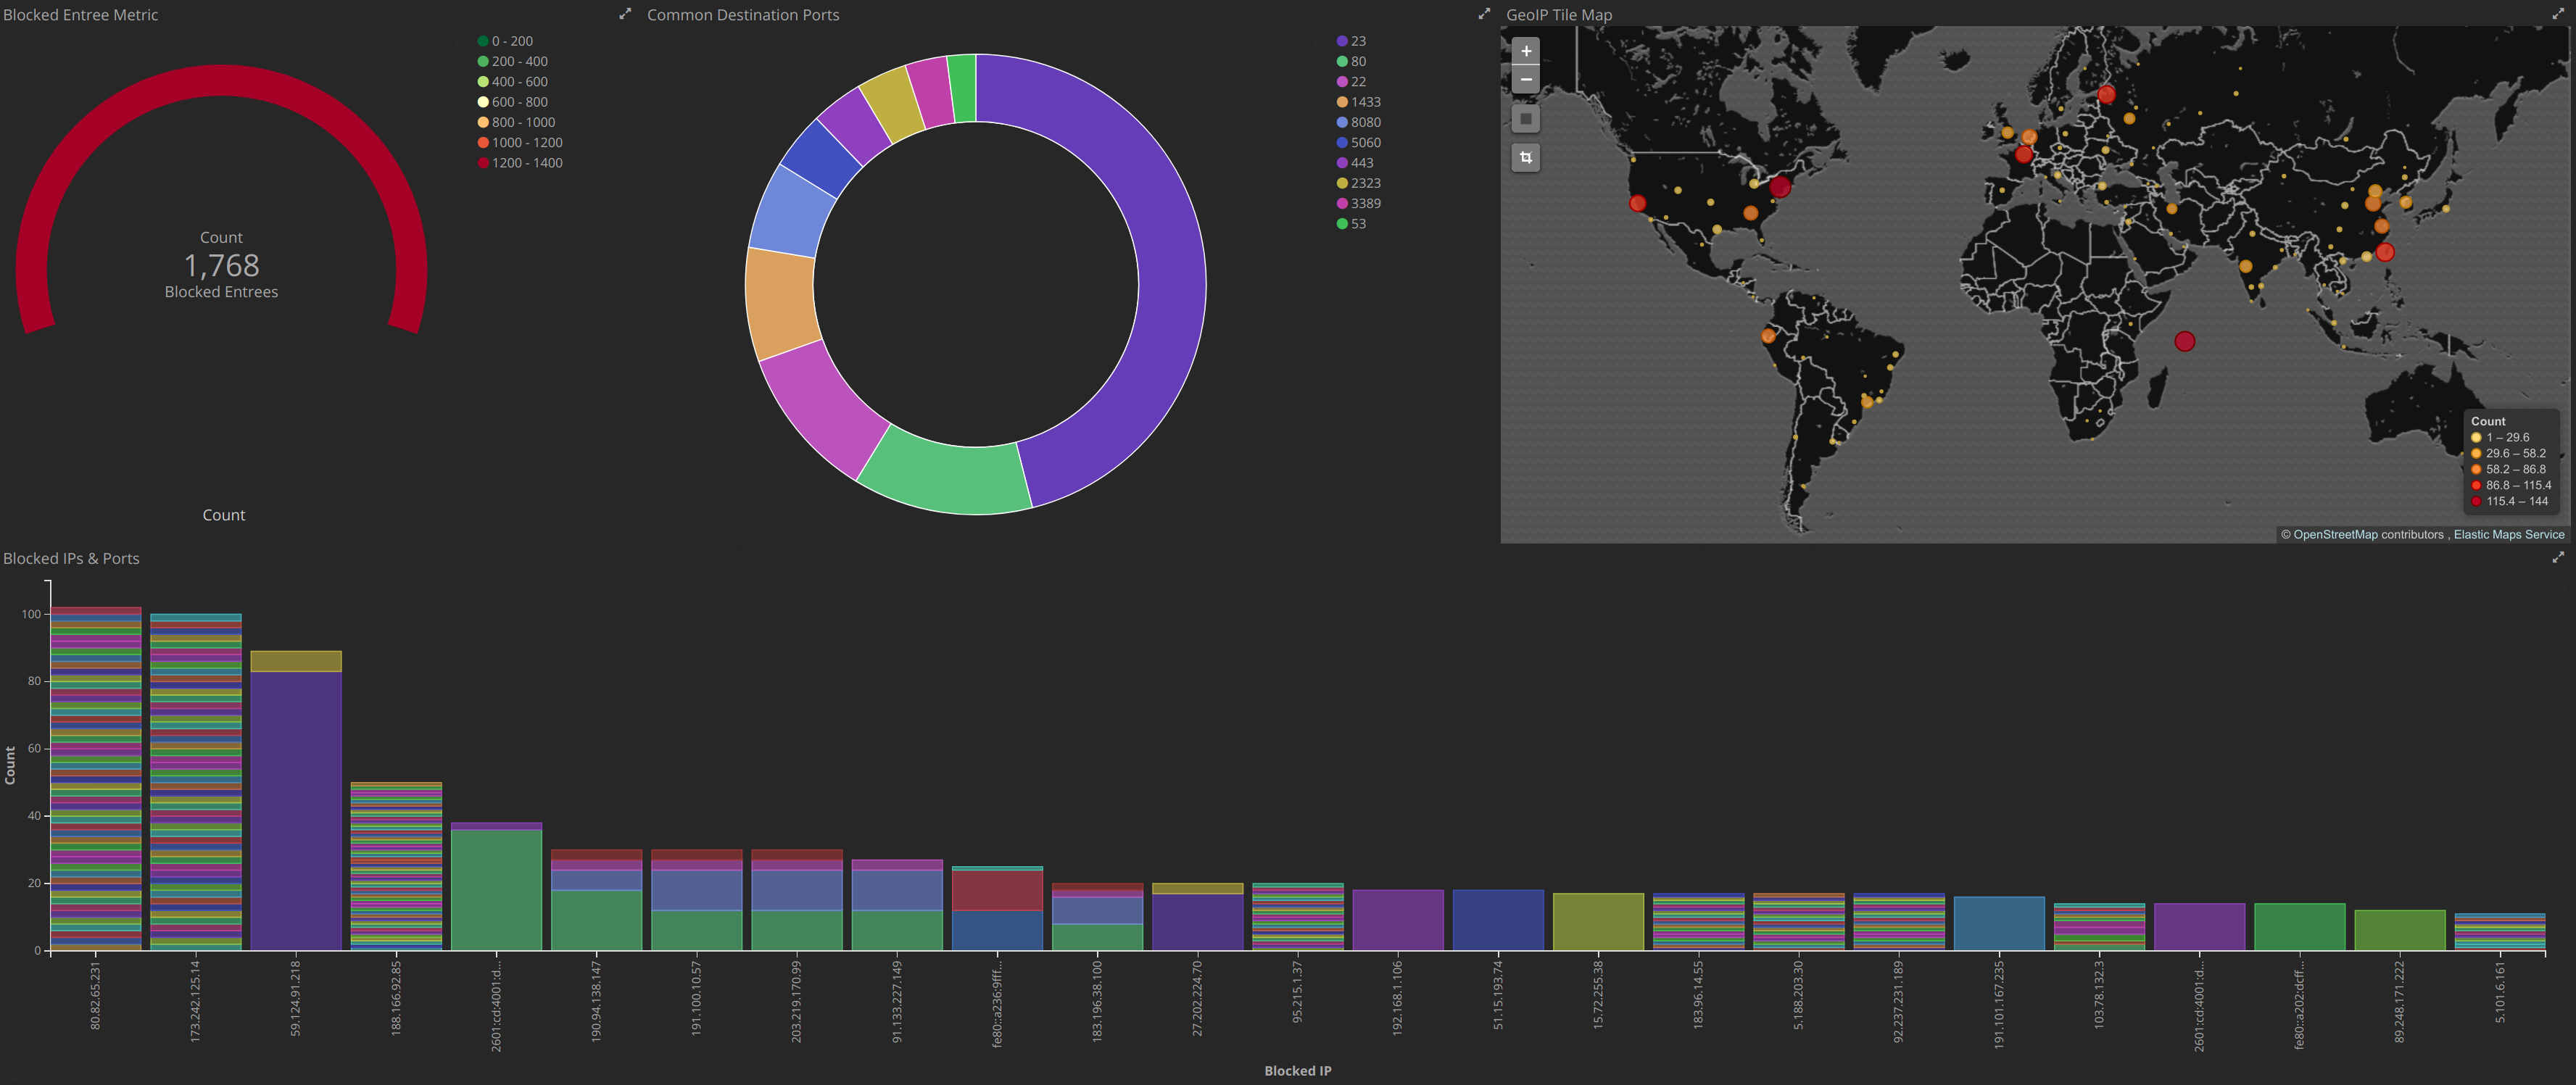
Logstash configuration for pfSense syslog events. Comes with a dashboard for displaying blocked events from the firewall.
Includes a modified logstash configuration to work with the latest pfSense release v2.5 and Elastic services release v7.
Enable remote logging in the pfSense web UI by going to:
Status -> System Logs -> Settings
Make sure that the "Log Message Format" is set to "BSD (RFC 3164, default)".
In Remote Logging Options, check "Enable Remote Logging", and add your remote Logstash server to the "Remote log servers". For example:
192.168.1.100:5140
Finally, check the "Everything" checkbox for "Remote Syslog Contents".
The directories pipelines and patterns are specific to the logstash configuration.
You will need to edit ./pipelines/30-outputs.conf to set the elasticsearch host connection.
Import the visualizations.json and dashboard.json.
There is an example Kubernetes kustomization for running ECK through the Elastic Operator.
Configuring and deploying the Elastic services in this way is beyond the scope of this document. But the yaml resources in infrastructure should give an idea of how to get that deployed.
Logstash is no longer a default component of the deployed Elastic services. logstash.yaml will show a way to deploy Logstash along side the other containers.
