Note: rgat is an active research project that has emerged from a long re-write. 0.6.X will be a series of preview builds. Don't let the flashy videos entice you into thinking that it will be useful on real targets
rgat is a dynamic binary analysis tool for gathering and visualising instruction traces. It is intended to help software reverse engineers in bridging the gap between the high level API view of malware sandboxes and the low level function view of disassemblers and decompilers - particularly where code obfuscation is present.
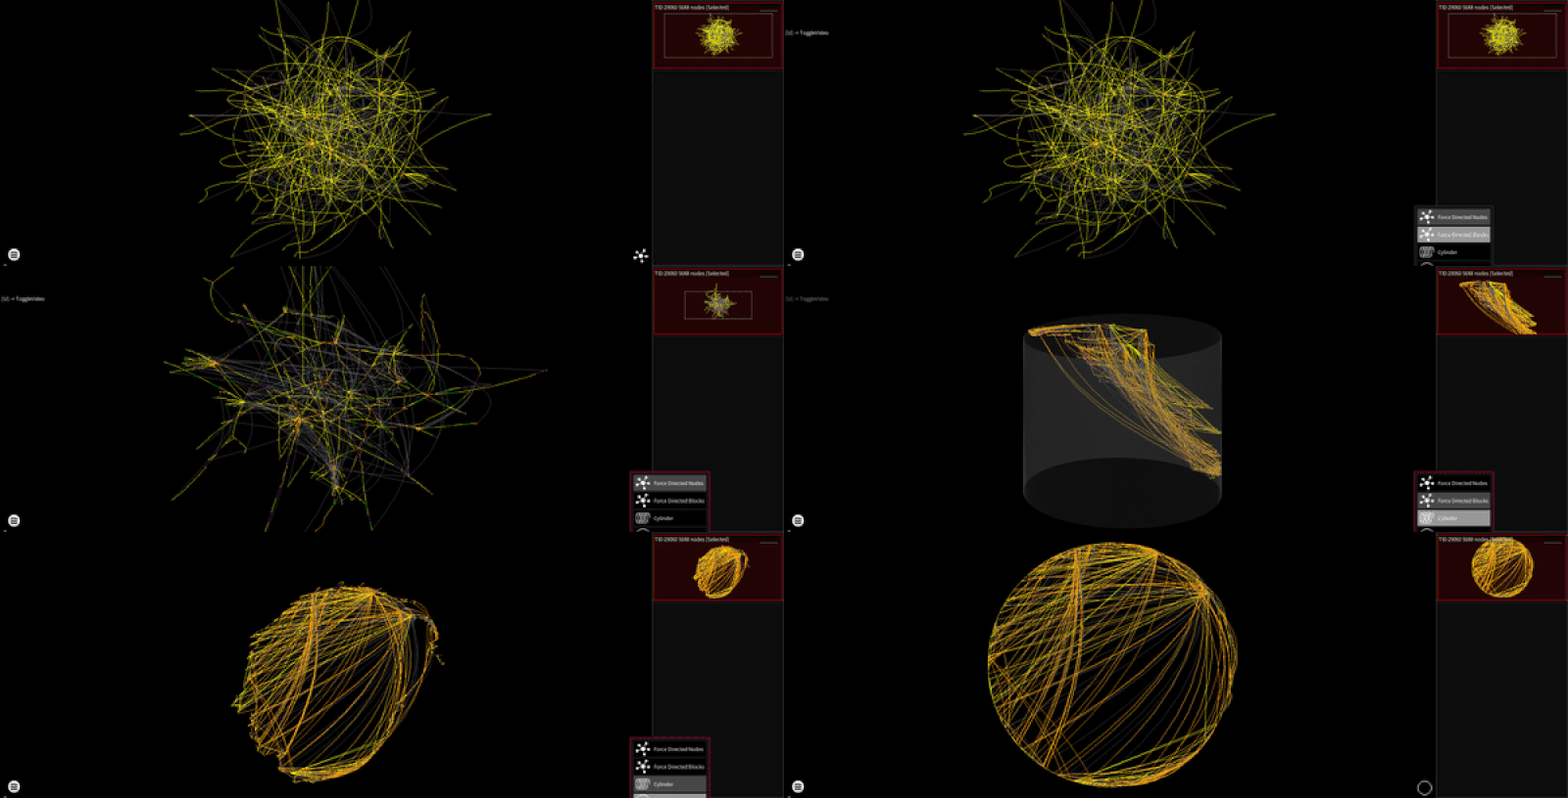
Different layouts

rgat_upx_24436_1103_211158.mp4
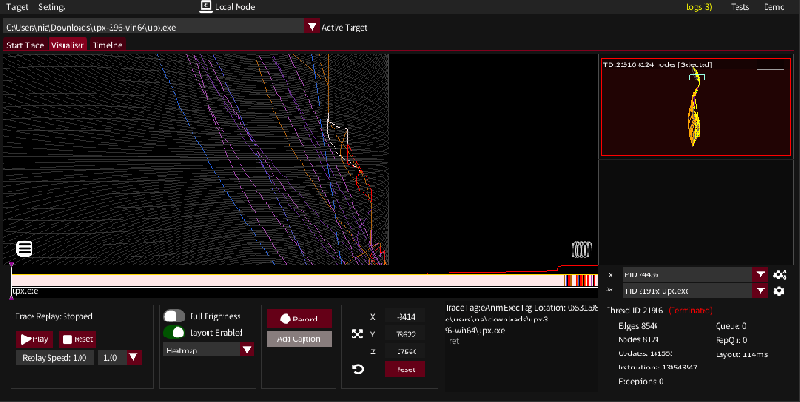
Live cylinder plot of UPX packing a binary
rgat_BlockingAPI_37092_1101_191127.mp4
- GPU accelerated graph layout
- Thread preview graphs
- Trace animation replay
- Heatmap generation
- API recording
- Signature scanning with YARA and partial Detect-It-Easy support
- Customisable instrumentation (module granularity)
- Remote tracing - perform tracing in real time over a network
See the Changelog for a full list of features
See the Trello for the features under development or scheduled to be worked on and known bugs
It currently supports 32 and 64 bit Windows EXE's and DLL's, but it now runs on .NET so Linux support should be slightly less distant that it was a while ago. It won't work very well with .NET apps.
The two main requirements for 0.6.0 are:
- Windows, with the ability to run .NET 5 programs
- For the computer running the visualiser: A GPU with Vulkan driver support (ie: this test program works)
- If .NET 5+ isn't installed, install it(run console apps -> x64). If nothing happens then running rgat in the console will tell you if this is the problem.
- Download the latest release - currently 0.6.0
- Unzip rgat.exe into its own directory
- Run rgat.exe - it will unpack the tools it needs into the directory it is launched in
- Configure it to your liking in the settings
If nothing else you may want to get familiar with the graph manipulation controls
- Drag and drop a binary onto the UI
- Click 'Start Trace'
- Pin's file API doesn't play well with named pipes, so an unsafe API has to be used causing some traces to fail to start (especially .NET programs)
- A console window opens with rgat to enable interaction with console-enabled targets. Selecting text will hang the UI on any output until the selection is cleared - which might happen at startup.
- Intel Pin for generating instruction traces
- Veldrid, a .NET graphics library
- Dear ImGui providing the GUI, via ImGui.NET
- Force-directed graph layout based on Jared McQueen's WebGL algorithm
- Capstone for disassembly
- Yara, via the Airbus CERT dnYara library
- A woefully incomplete .NET port of the Detect-It-Easy engine
- PeNet for static analysis of PE binaries
A full list and discussion of libraries can be found in the development documentation
