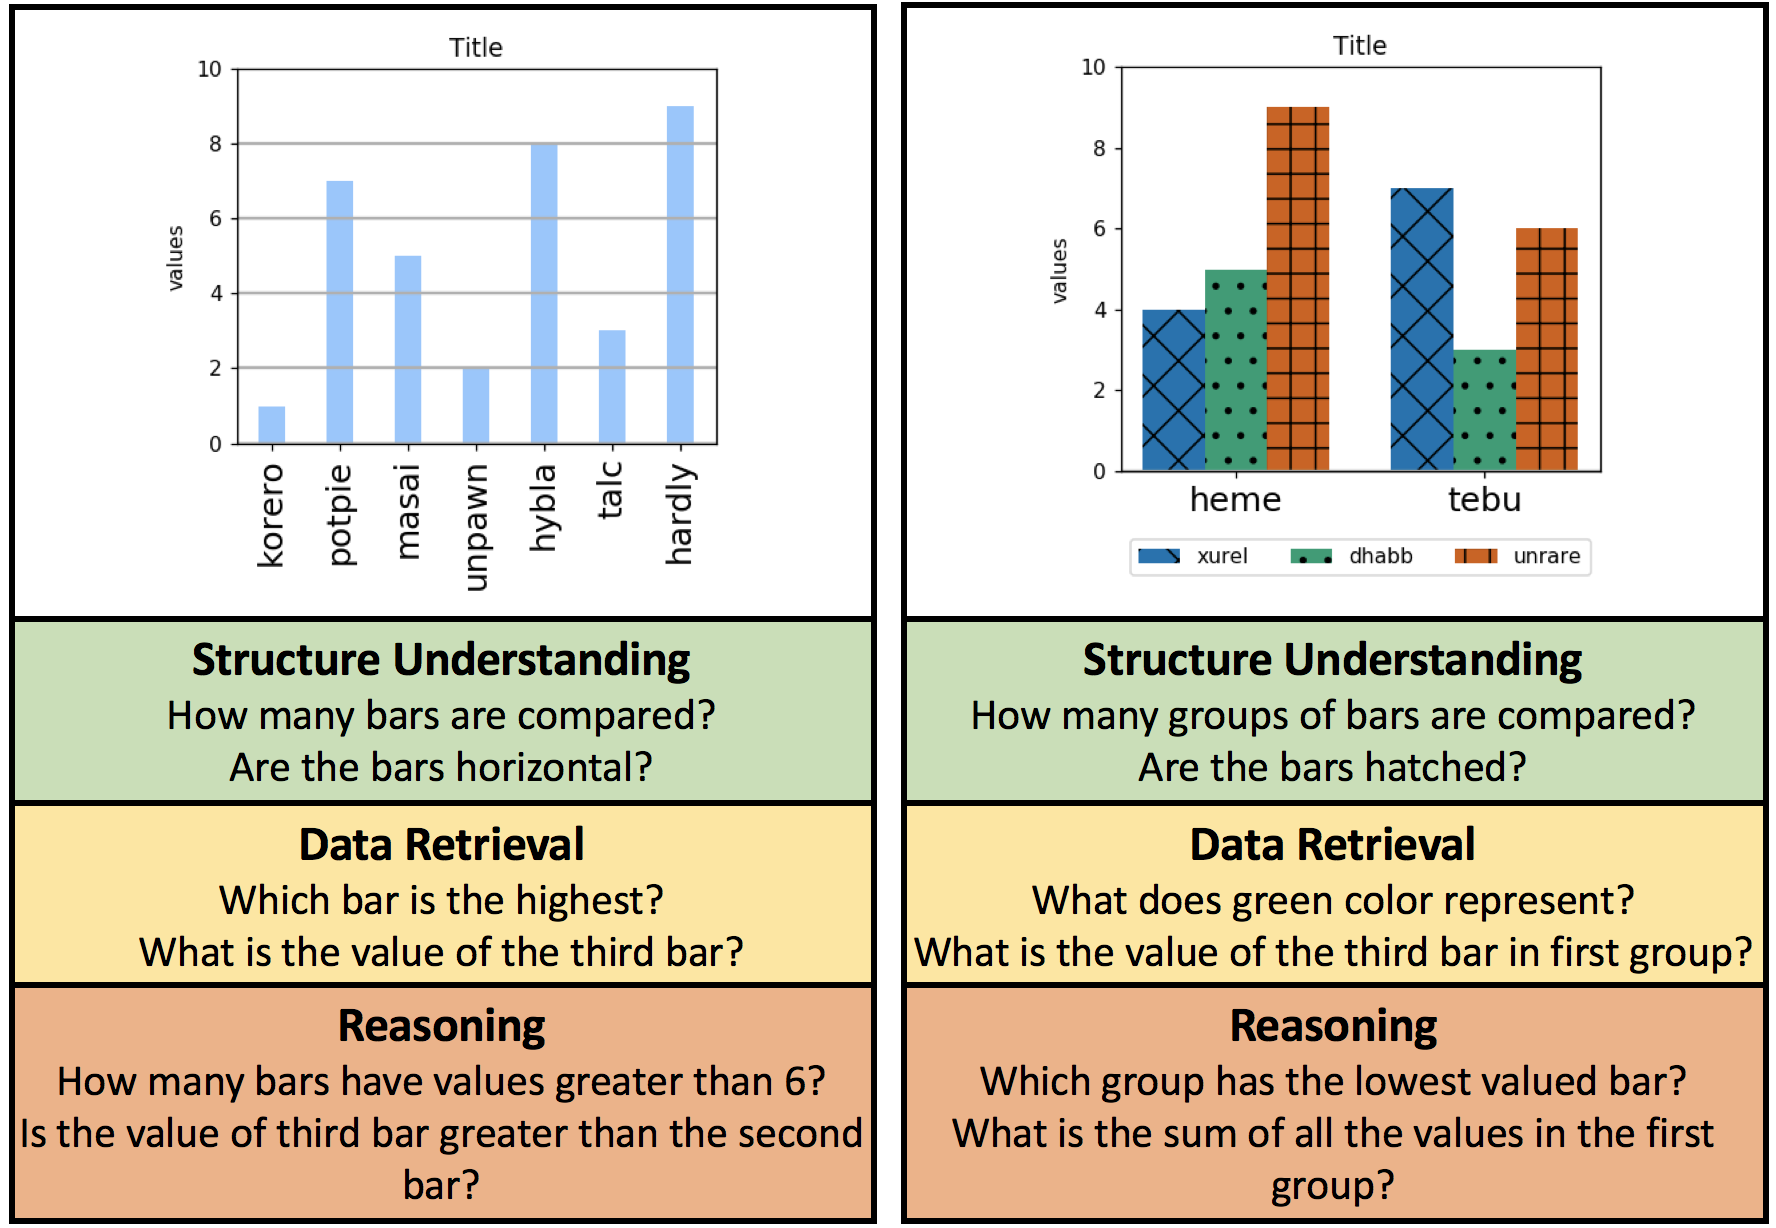
This repository provides the images, metadata and question-answer pairs described in the paper:
DVQA: Understanding Data Visualizations via Question Answering
Kushal Kafle,
Brian Price,
Scott Cohen,
Christopher Kanan
To be presented at CVPR 2018
Please cite the following if you use the DVQA dataset in your work:
@inproceedings{kafle2018dvqa,
  title={DVQA: Understanding Data Visualizations via Question Answering},
  author={Kafle, Kushal and Cohen, Scott and Price, Brian and Kanan, Christopher},
  booktitle={CVPR},
  year={2018}
}
A live demo of our SANDY algorithm as described in the paper above can be found in this url
Download images using this url. The images are all in the same folder and are named as
bar_{split}_xxxxxxxx.png
where,
xxxxxxxx = image_id padded (right justified) to length of 8 characters
split = train, val_easy, or val_hard
The images expand to about 6.5 GB.
The question-answer pair can be downloaded from this url. It consists of three files, one each for three different splits of the dataset named as {split}_qa.json It consists the following fields:
image: The image filename which the given question-answer pair applies to
question: Question
answer: Answer to the Questions. Remember that (cardinal numbers (1,2,3...) are used when
	the number denotes the value and words (one,two,three...) are used to denote count
question_type: Denotes whether the question is structure, data or reasoning type
bbox_answer: If the answer is a text in the bar_chart, bounding box in form of [x,y,w,h], else []
question_id: Unique question_id associated with the question
The question-answer pairs expand to about 750 MB.
In addition to question-answers, we also provide detailed annotations of every object in the bar-chart that can serve as either the source of additional supervision (à la our SANDY and MOM model) or use it to do additional analysis of your algorithm's performance.
Metadata for the bar-charts can be downloaded using this url. It consists of three files, one each for three different splits of the dataset named as {split}_metadata.json It consists the following fields:
image: The image filename which the given metadata applies to
bars:
	bboxes: Bounding boxes for different bars (number_of_bars x number_of_legends x 4)
    	names: Names for each bar in the form (number_of_bars x number_of_legends)
	colors: Color of each bar (number_of_bars x number_of_legends)

texts:
	text: The string of the text-block in the bar-chart
    	text_function: The function of text (e.g., title, legend, etc)
    	bbox: The bounding box surrounding the text-block

table: Underlying table used to create the chart saved in the following format.

	single row charts:
		C_1 	C_2 	C_3	...	C_N
		-------------------------------------
		V_1	V_2	V_3	... 	V_N

	multi row charts:

		None |	C_1 	C_2 	C_3	...	C_N
		-----|---------------------------------------
		R_1  |	V_11	V_21	V_31	... 	V_N1
		R_2  |	V_12	V_22	V_32	... 	V_N2
		...  |	...	...	... 	... 	...
		R_M  |	V_1M	V_2M	V_3M	... 	V_NM
Since numpy arrays are not supporte by JSON, the tables are saved as nested lists. Converting them to numpy array, e.g., table = np.array(metadata['table']) might provide easier access to the elements, e.g., for multi-row charts, table[1:,1:] contains the numeric data, table[1:,0] contains the row names and table[0,1:] contain the column names.
The annotations expand to about 800 MB.
Feel free to contact us (contact details on the paper PDF) about any questions, suggestions or comments about either the dataset or the methods used in the paper.
