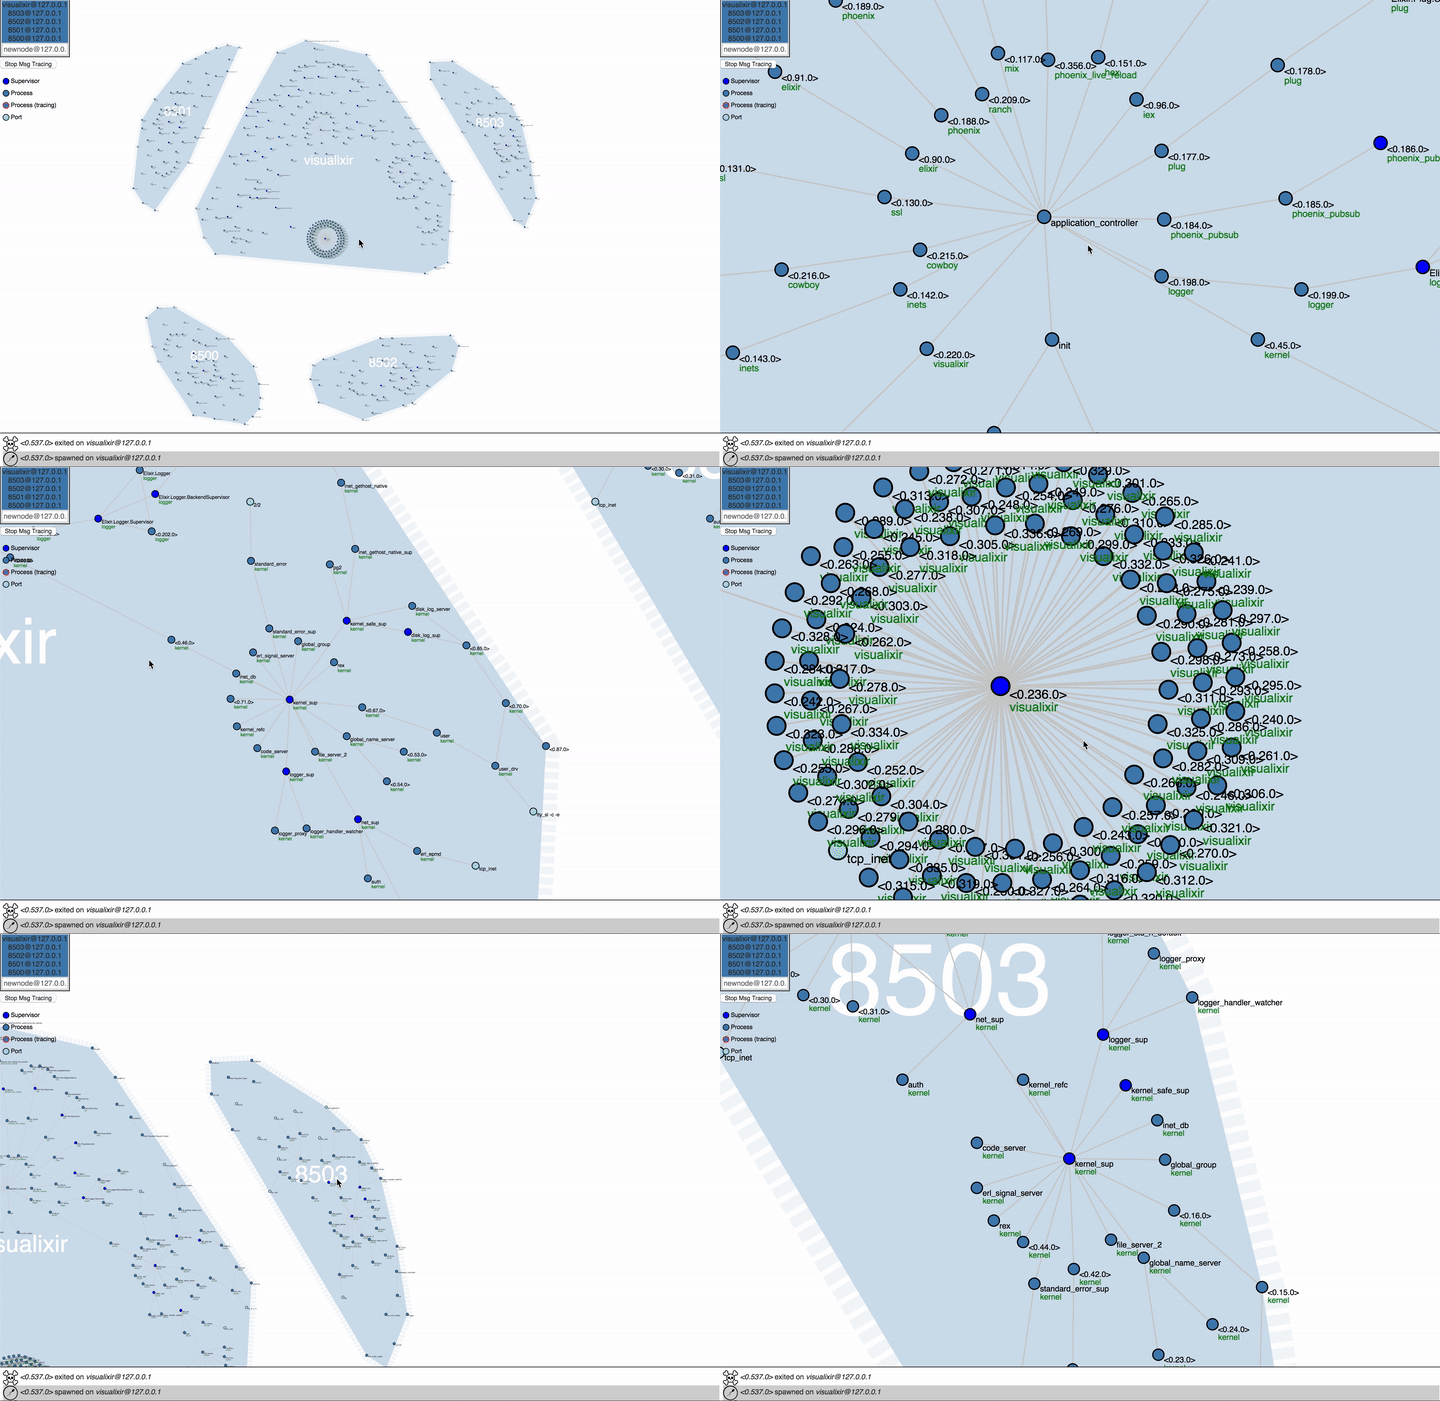
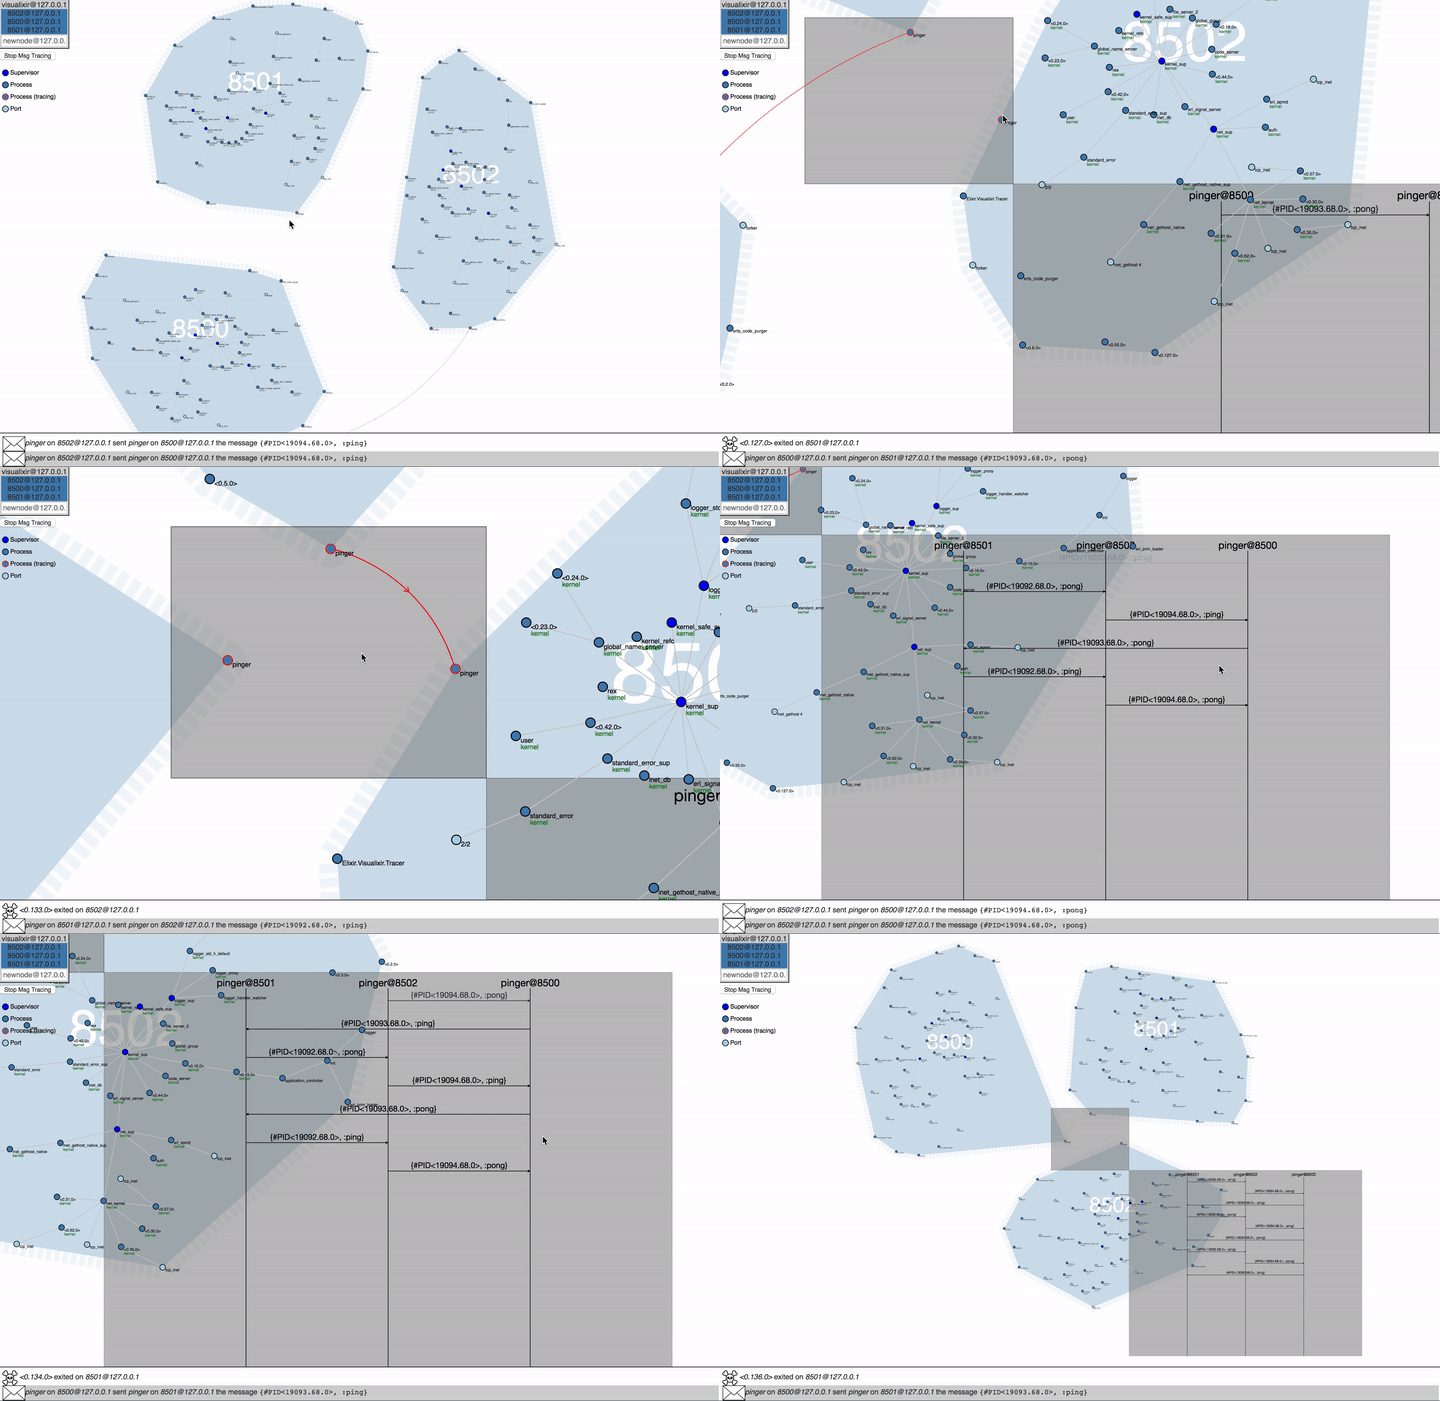
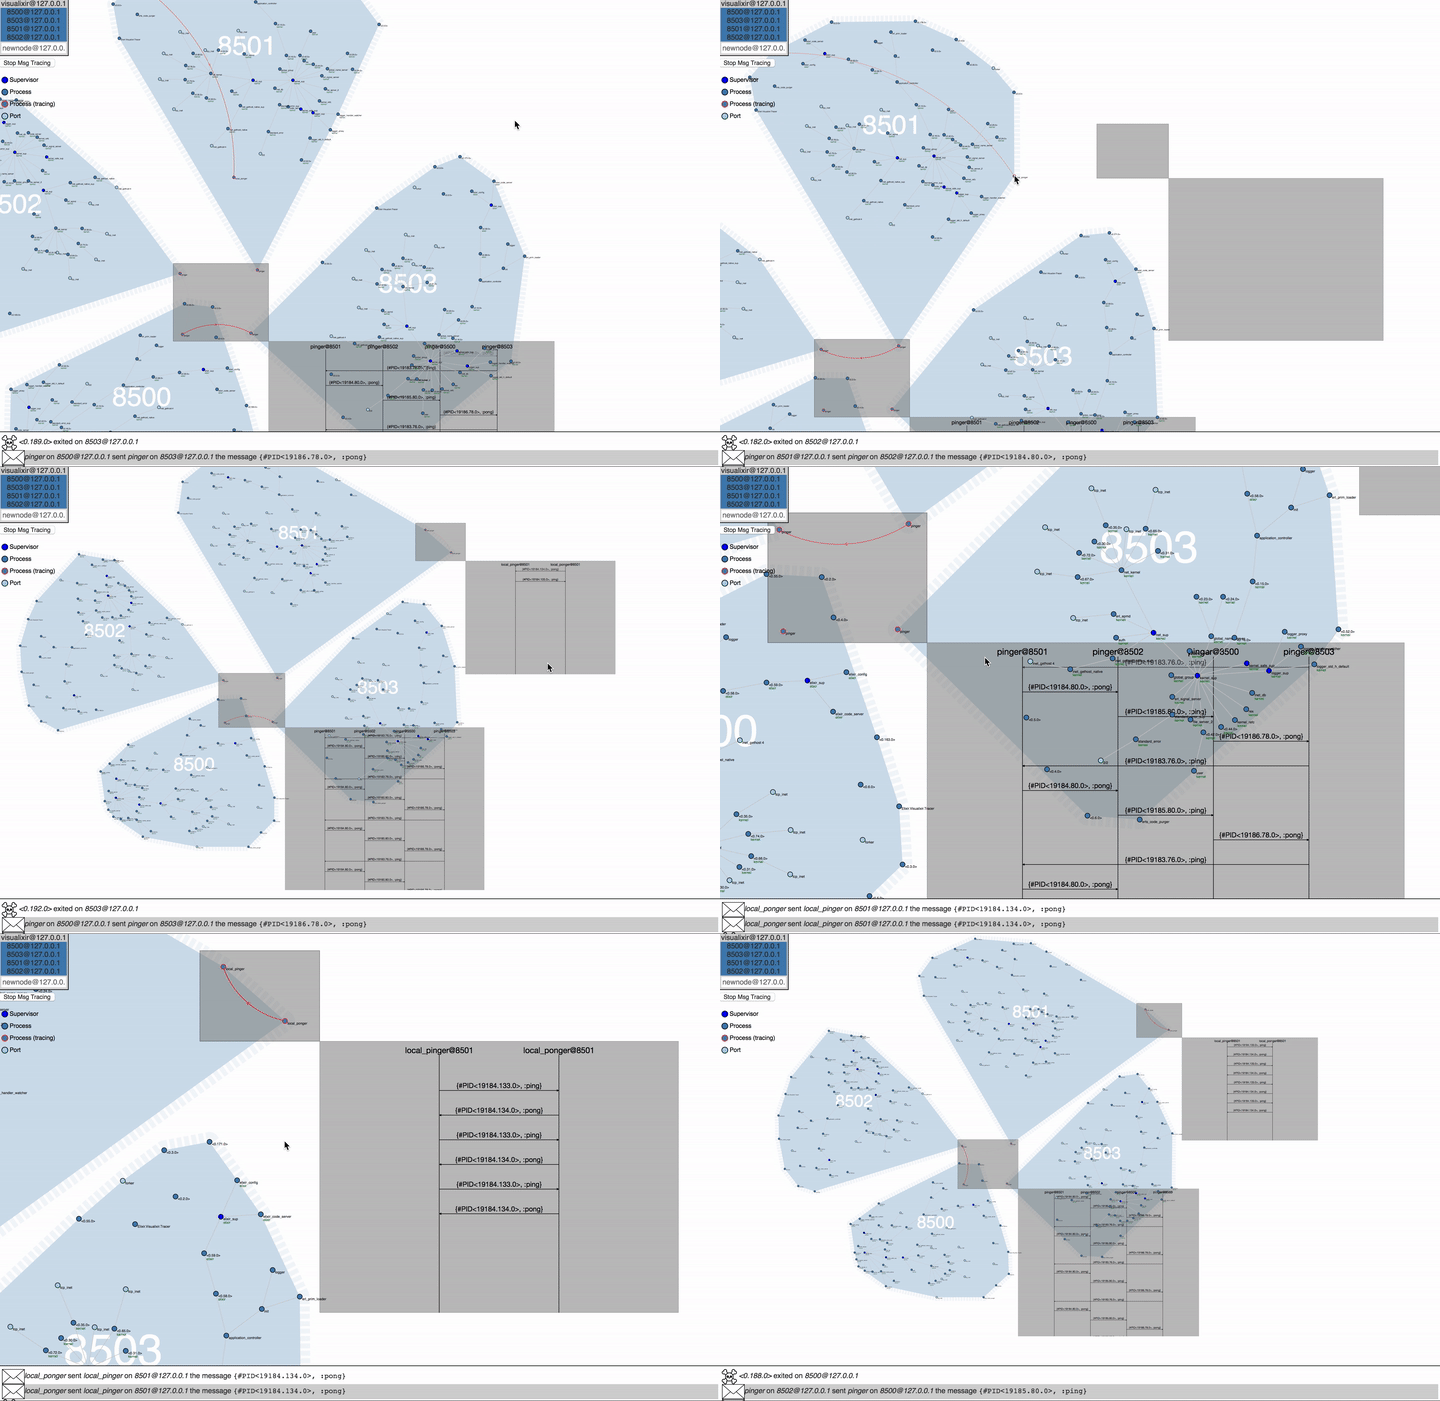
Visualixir is a toy visualizer for BEAM nodes, written in Elixir + Phoenix + d3, with live message sequence charts.
It's largely intended as a teaching tool, to give newer BEAM programmers a look into the process ecosystem living inside their nodes. However, it may prove of some amusement/use to more experienced folks (it's kinda neat to trace iex and the io system).
Huge gifs are worth a thousand words:
- Clone this repository.
- Compile:
mix deps.get && mix compile && cd assets && npm install && cd - - Start 'er up:
elixir --sname visualixir -S mix phx.server - Navigate to the GUI
If you want to visualize other BEAM nodes, you'll need to start them up with the --sname <unique_name_here> option.
I suggest you use Chrome for Visualixir, Safari and Firefox's SVG performance seems to be lacking. :(
There are a couple example modules included, SingleNodePingPong and MultiNodePingPong. Additionally, there's a Cluster module to start up additional :slave nodes.
On the upper left of the terrible GUI is a list of nodes that Visualixir curently knows about, including itself. You can click on a node's name to visualize it, or you can add a new node by entering it in the text box.
Drag the background to pan around.
Move processes around and pin them down by dragging and dropping. To un-pin, double click.
Zoom by scrolling (mousewheel or two-finger swipe).
Option-dragging (alt-dragging), will open a new "conversation", you can drop a set of pids into the upper left box to start tracing, you should see messages they send/receive in the adjoining box. Its outline will change to red to remind you that you're tracing it. You can click the Stop Msg Tracing button to halt all message tracing.
The live message sequence charts have a configurable fade time, but there's no GUI for it yet, see web/static/js/message_sequence.js
The charting library is here, and it'd love some pull requests. <3
Do not run Visualixir on production nodes, seriously. I've tried to make it somewhat safe, but I suspect you can get into some bad message-tracing scenarios that'll compromise your node.
This a prototype, obviously, the code is a steaming pile of garbage. Visualixir is largely intended to be a playground for screwing around with visualization ideas. I'd love to see what folks come up with, PR's are gladly accepted! 💕 (the GUI needs a lot of help)


