This article is a logical continuation of my old article about brainfuck visualization of algorithms in a virtual machine with cyclic memory. Heavy videos and images are placed under the cut.
Why print-like debug? Print is the easiest tool of imaging processes and memory. It's good because it works together with written code (as opposed to a debugger, such as that in Swift language - sometimes it doesn't even stop on breakpoints) Now imagine that all of the program work cycle can be visualized through the print? It would seem cumbersome and ugly, but if the program does not take up a lot of memory, it can be a viable option.
Of course, this kind of visualization can't be complete without information about CPU registers, stack and heap. The RayFoundation allows to substitute memory management pointers (as malloc, free) at the library level, and thus to control and / or sandbox your code.
We can assume that the sandbox creates a continuous memory page of the specified size. As it turned out, it was sufficient to test Ray with 256 x 256 = 65536 bytes of memory (size + sandbox itself). This works in "simple" and " ASLR " modes. Difference in these modes will be clearly demonstrated by the means of print visualization.
Source codes of visualizations are in this commit.
- Make a sandbox and select its size
- Introduce a small delay in the program (in this case - delay during malloc, calloc, realloc, free; these are the only control points that don't change your code, you can paste usleep everywhere, for those who aren't lazy; unless it's an inject-library for analysis, in that case memory management pointers are the only reference points for analysis)
- Display sandbox memory in the terminal via ncurses in a non-main (?) thread
Easier said than done. Here are the first results (watch video in full screen mode):

Each colored dot is a byte of memory with a value >0; null bytes are black;
In the default mode, each element can be malloced in the beginning of the free memory area. This is a great way to see what the code does and learn more about its structure.
Ray lib is characterized by autoPool, which cleans memory if needed - an array that holds all the pointers to malloced objects. like a bag in a bag, because the pool is running inside the sandbox, and I worked a lot to achieve this effect. As a result, you can create a variety of sub-pools and sub-sandboxes to play in. Approximate diagram objects:
Cool enough, isn't?
You can see how memory looks like and test yourself on a static and dynamic analysis in detecting individual objects or storage structures. The case above is great for the real world tasks.
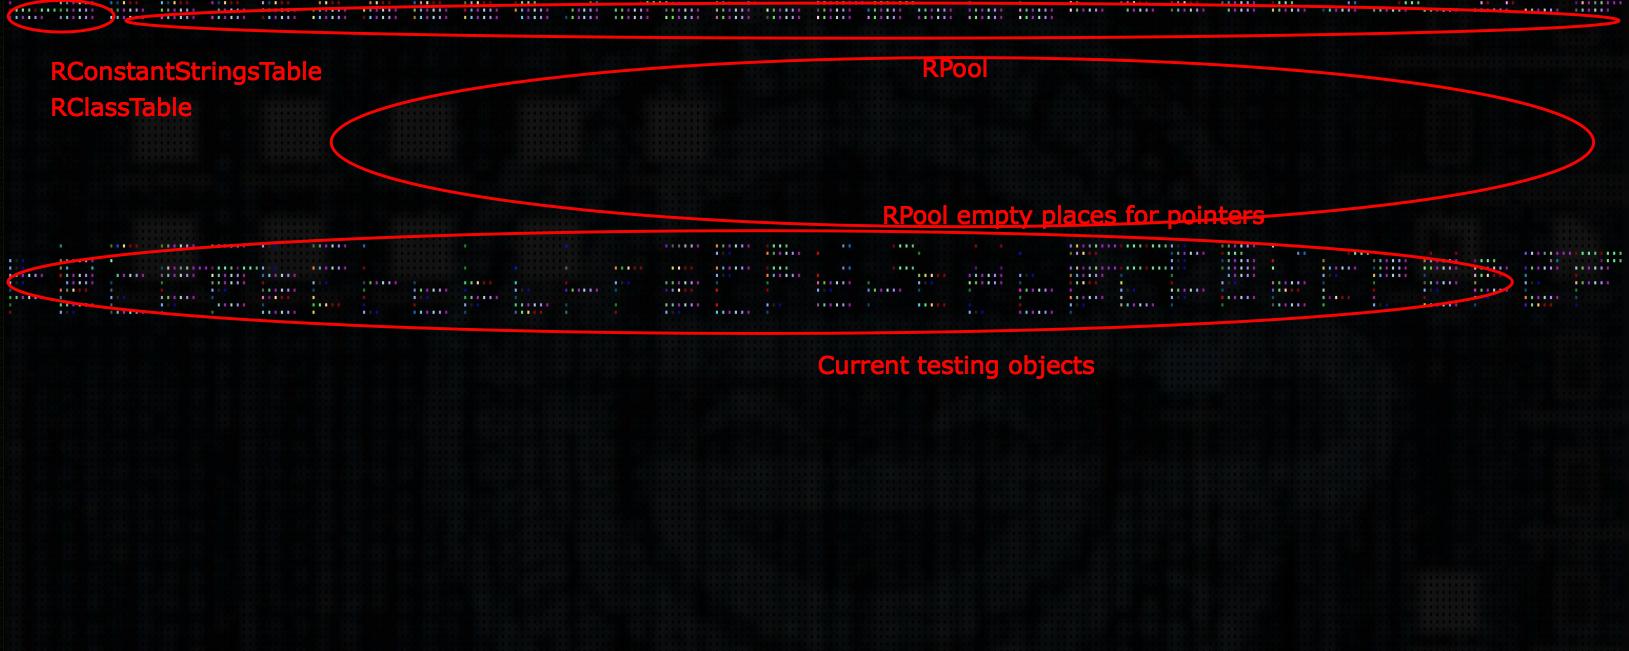
Here is an example of a standard sandbox with "saturation", i.e. place remote objects reused and does not vanish:

Note several things regarding security:
- objects that have been in the memory for a long time still can be tracked (RPool at the top of the screen)
- some critical information may not remain remote, and it can be read
- uniform "trashing" in the work area does not clearly identify what objects perform work there
- you can carry out a partial analysis of the region byte values, and try to identify the main operational structure, but "trashing" makes it a little harder

Even steeper. But, in this picture it is difficult to dismantle it. The only thing that I saw here is active area that is constantly changing every time screen refreshes. What could the region it be for? It keeps changing yet remains at the same place.
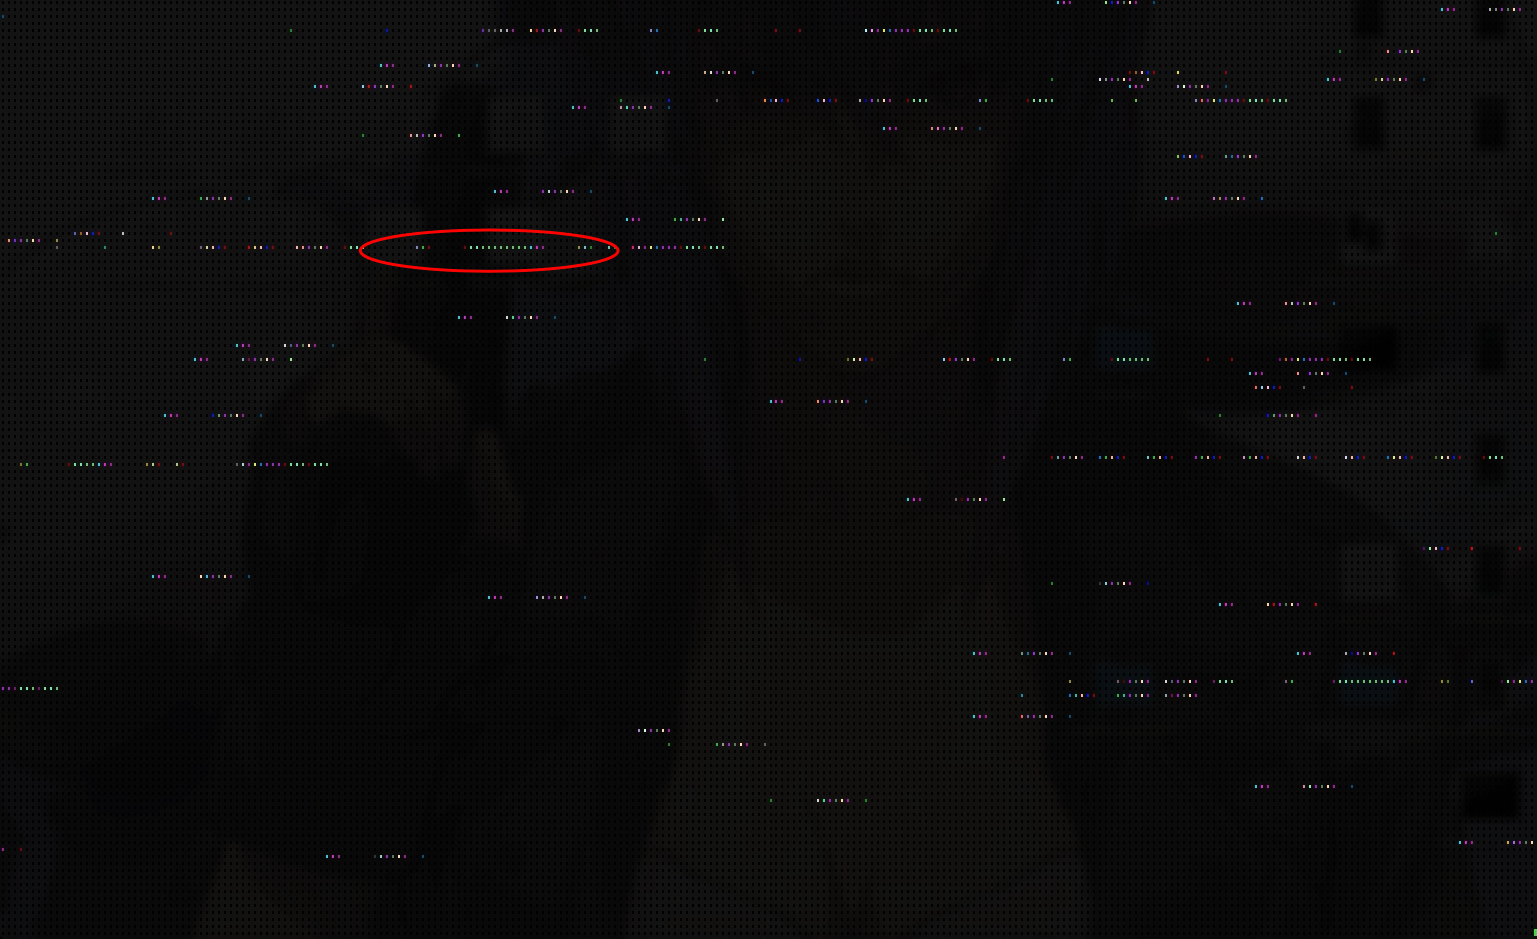
Answer
This is RPool-counter; it knows how many pointers currently are on the heap, and next to it is the counter of free places allocated for additional pointers
You can select some more features for ASLR-mode
- with architecture that creates objects with big count of pointers to other objects and intense work, "trashing" made analysis pretty hard, because a static part of the object can be in one piece of memory, and the rest of sub-objects can be in a completely different place
- by means of lifetime of objects and changes in intensity, the pieces can be recognized as certain parts of the program
- memory uniform distribution looks safer because of the fact that attacker doest not know the values of the PRGs and cannot carry out an attack on a particular object pointer. If the object uses realloc, the attacker does not know the time of realloc, hence it is impossible to make time-long attack, because the main object pointer changes
- a partial analysis of the range of values bytes can be done, also one might attempt to identify the main operational structures, but with multiple sub-parts and reallocing it's almost impossible

At the end of the video space "trashes". Features of this mod look like a features of default mode with saturation and ALSR mode, i.e. due to the high intensity of work in the heap it is generally difficult recognize work with any parse, except most of the active region from the previous screenshots, but if at some point this structure reallocs, this possibility would be lost.
There are a couple of videos from the visualization of RList tests, on a smaller piece of memory and at a larger scale.
default-mode:

aslr-mode:
