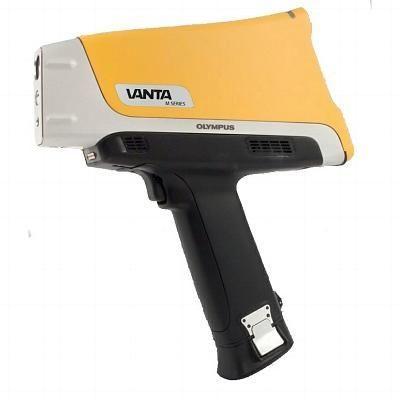
- OLYMPUS VANTA pXRF device
- GeoChem export method
Ensure the CSV export follows the GeoChem format with Item notes labeled as LAB_ID. The ID should contain both letters and numbers for string value compatibility.
This tool is tailored to parse XRF databases exported in the GeoChem format from the OLYMPUS VANTA pXRF. It selectively retains element composition and item IDs for analysis.
The following are the functions of each Tab and sub Tab and the sequence of data parsing.
Displaced raw data from the XRF chemistry output, with <LOD values being replaced with 0.
Provides control for selecting lab items and elements. Selecting normalized data, normalizes all reading of selected elements to 100% across each reading. This value determines all the following tables and calculations.
This sub-tab provides elemental concentrations of selected elements, in either standard or normalized format. The values of this table influence all the following tables.
Based on the data seen in the "Selected Items" tab, shows the mean, standard deviation, and minimum and maximum values for the multiple readings of each item.
Based on data from "Elements Overview", this show a table with items and elements with standard divinations higher than a threshold set by the slider.
Based on data from "Selected Items", show a table with individual readings of items with elements with a z-score of each elements reading, higher than a threshold set by the slider.
Allows for parsing though multiple readings of each item individually. The Item of interest can be selected using the drop-down.
Pulls data from "Selected Reading" and filters in the Item selected from the drop down menu. It also Plots the elemental percentage of each reading as a Box plot. The elements shown can be selected suing check boxes.
Pulls data from "Item Data" and elements with a standard deviations and the table with element concentrations with their related Z scores, along with the Standard deviation, and the range between the minimum and maximum values. The text summary of the elements is also presented.
Enables the deselection of readings which are deemed as out liars.
Pulls from the table "Selected Items", and filters out all the reading which were deselected.
Pulls from the table "Selected Reading data", and gives summary in the form of mean, standard deviation, and minimum and maximum values from the multiple readings of each item.
Generates grouped bar plots depicting averages and standard deviation errors for each selected element and item based on "Summary of Reading data".
It also enables the download of tables of "Primary Data", "Selected Items", "Selected Readings" and "Summary of Reading data", as worksheets in a Excel file.
This is a simple plotting functions for XRF beam spectra data. This only works with 2 beams, of alloy Plus. A third beam option is in the works. The drop-down menu is used for selecting the reading number. Use the sliders to set X and Y axis limits and use other options to shave the image. The association of the reading number with the Lab id needs to be done manually. I am working on a program that will do that automatically in the future.
This tool streamlines the analysis process for XRF data sets, offering flexible filtering options and insightful visualizations.
